Build 1.2.15 released for selected POC customers.    Download

Current list of major features that are available out of the box without special licensing:

  1. Network Discovery
  2. Network Monitoring (SNMP v2/v3)
  3. Netflow Collector (requires second VM for storage)
  4. Syslog Server
  5. SNMP trap Server
  6. Network Topology Visualization
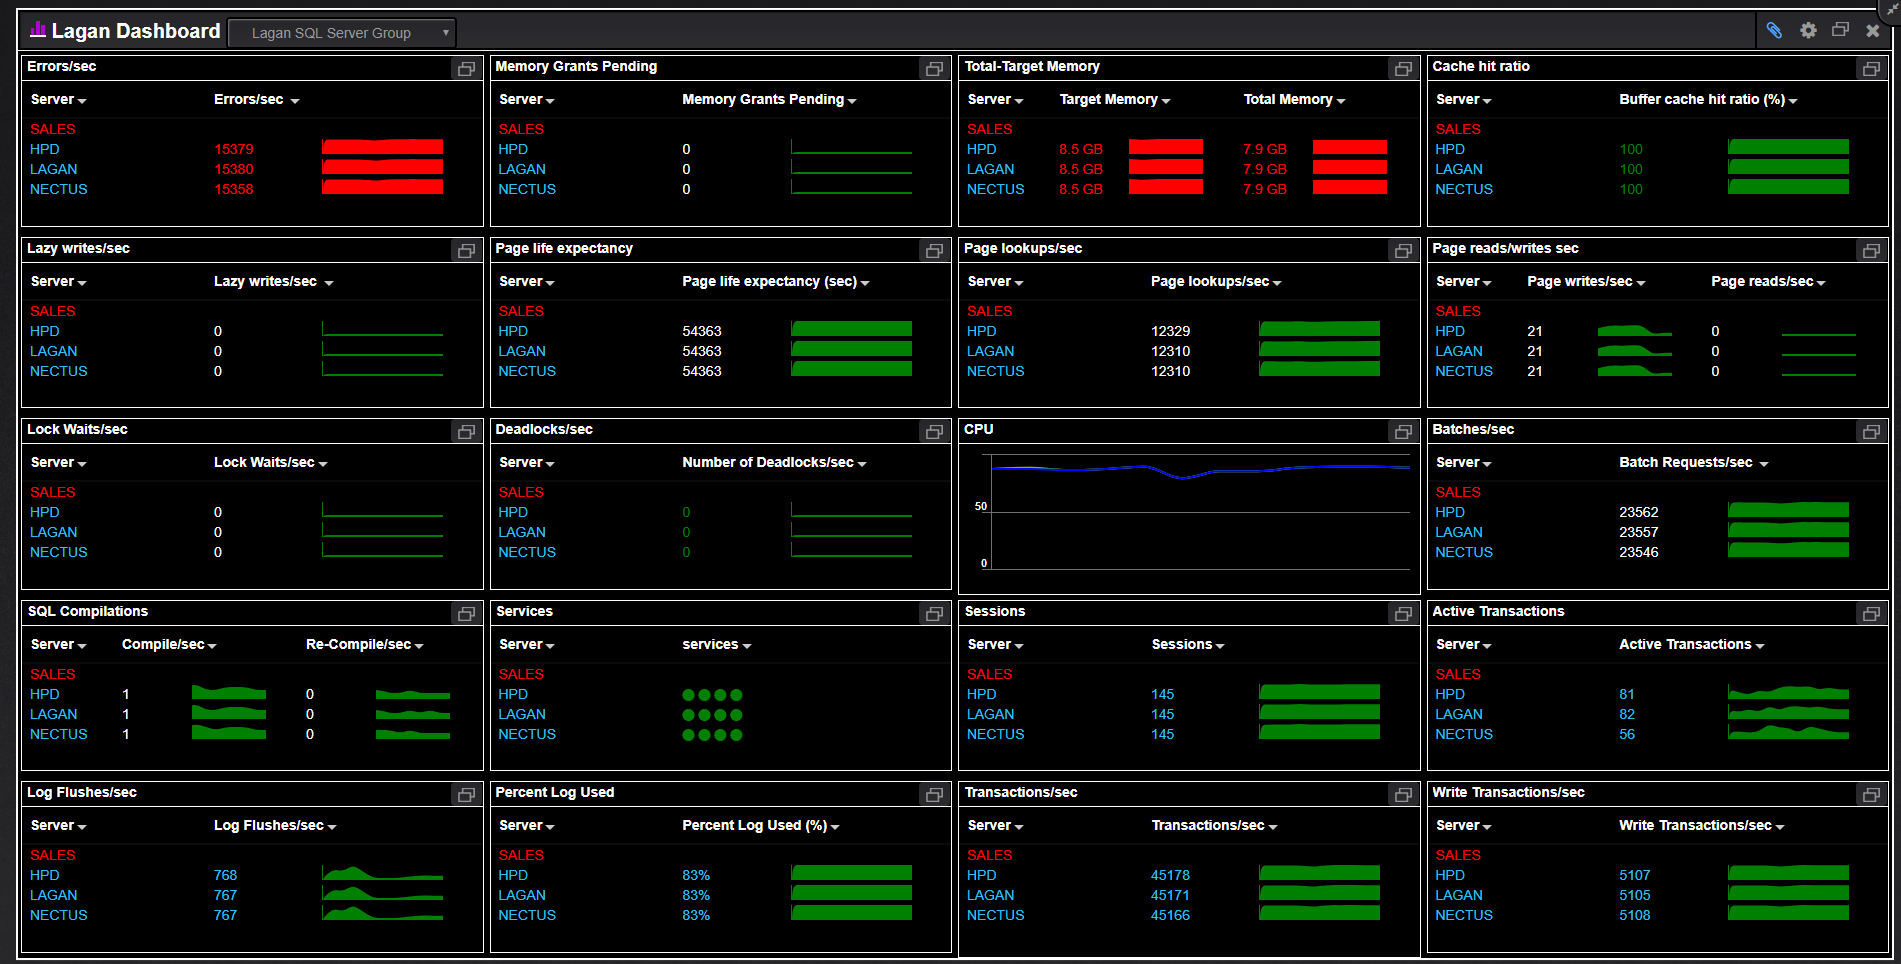
  7. HTTP URL Monitoring
  8. SQL Server Monitoring (new feature)
  9. Windows Server Monitoring
  10. Command Scripting
  11. Routers Configuration backup and change tracking
  12. Ping plotter
  13. Web based SSH client
  14. SNMP Walk with GUI


I am not a job market but I guess some of the keywords it my profile rang a bell in their matching script
but what startled me is the job title: “Splunk Network Architect”.. Since when managing software tools becomes a full time job?
The golden rule here is: When software tool takes more times to manage than it saves, it is time to get rid of it.

With Nectus you don’t have to write custom Perl/Python scripts to get what you need, It is our developers’ job.
With Nectus you don’t have to install third-party macros… It is our developers’ job.
With Nectus you don’t need more than 5 mouse clicks to get any report. We actually counted it.
With Nectus you don’t have to hire full time Architect to manage it.
Nectus GUI is very intuitive, we have seen CEOs login and use it without any formal training :)
The most common words we hear when people see our Demo is: “Cool”, “Awesome”, “Where were you when we bought [network tool name]”?

Try it yourself for 60 days
https://nectus5.com/download/

Today we have achieved a new millstone with our Netflow collector performance:
50,000 flows per second processing speed was reached in Windows Server 2016 VM.
This rate was reached on VM with 64GB RAM and 1TB M2 SSD.
To simulate this flow rate we used 10 isolated instances of Netflow generator from Virtual Console (www.vconsole.com) with each instance generating 5Kf/sec.
There is no Netflow collector on the market that we are aware which can sustain this Netflow packet rate.
This explains why large cloud providers turn to Nectus for their Netflow processing needs when other tools fails to deliver.

Download 60 day trial:     Nectus Download

Keeping your Visio network diagrams up-to-date is a full time job and not a fun one.
For any decent size network there are always changes happen every day and it is almost
impossible to keep track of those not to mention about adding those changes manually in Visio files.
The time of manual, static network diagramming is over.
Nectus (www.nectus5.com) is a a tool that makes all the manual work from network diagram creation process obsolete.
Nectus is the most advanced network discovery tool on the market that can generate network diagram
of any part of you network. You only need to pick a starting point, right-click and Select
“Expand Network Topology” and awesome looking network topology based on information from daily network discovery
will be ready in seconds. Network diagrams are based on database of “interconnections” discovered
via CDP and LLDP protocols which Nectus uses during its scheduled discovery jobs.
So as long as you run your discovery every night you can wake up every day knowing that that all of your
network diagrams are up to date.

Version 1.2.16 released on November 15, 2017 added ability to monitor Microsoft SQL Servers. Monitoring for 75 different SQL server metrics.
Server, Instance and Database level statistics.

Dashboard Example:

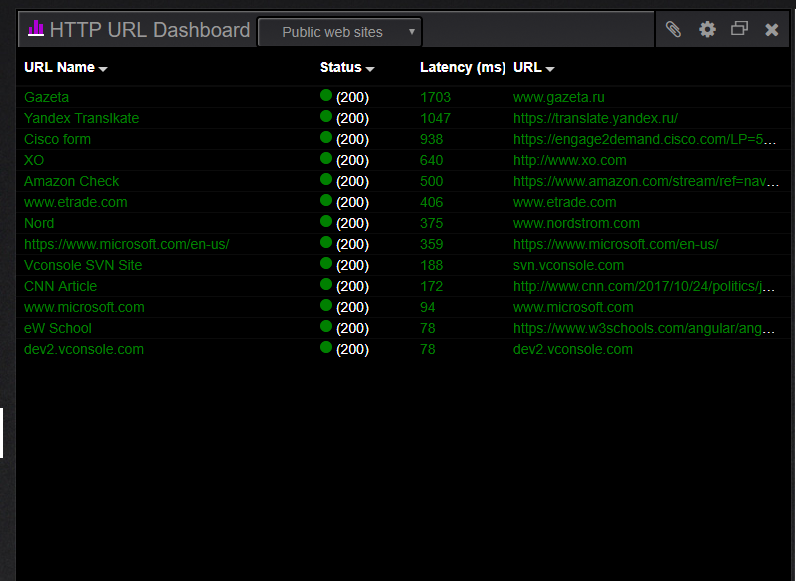
Starting from Nectus version 1.2.10 we added ability to monitor any HTTP URLs for up/down status and latency.

Configurable polling intervals  and URL dashboard added to standard list of dashboards.

“URL Down” alerts can be sent via email or SMS/text messages.  GSM Modem is required for text based alerts.

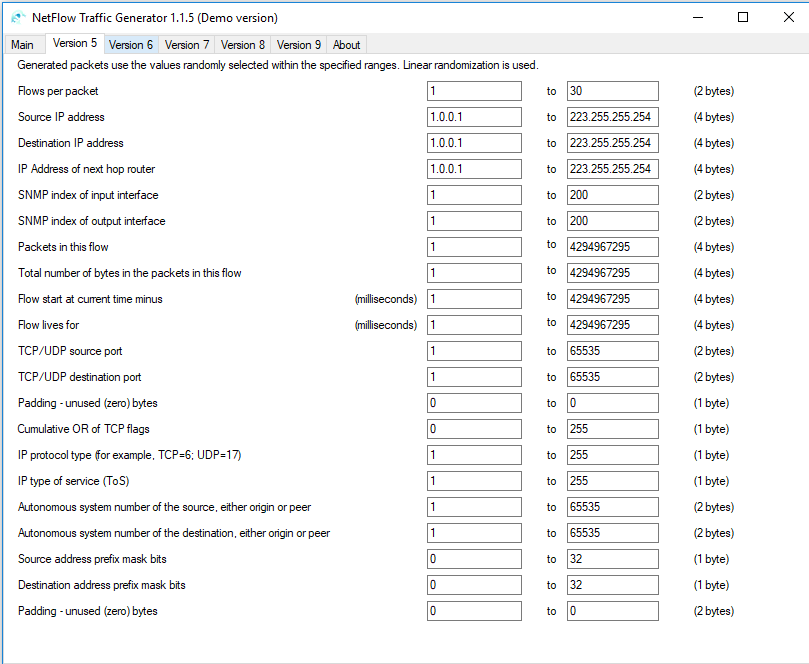
We offer NetFlow Traffic Generator utility that can send up to 30k flows per second with randomized parameters.

This tool is ideal for anyone who is developing Netflow Collector functionality.

Allows to generate large amount of NetFlow packets for protocol versions: 5, 6, 7, 8, 9 as if they were coming from real routers or switches.

Windows GUI provides control for every single parameter of the NetFlow packets.

Randomizaton of flow data. Support for multiple collectors. Simulation for up to 5000 routers.

Runs on any Windows OS.

Download Netflow Generator

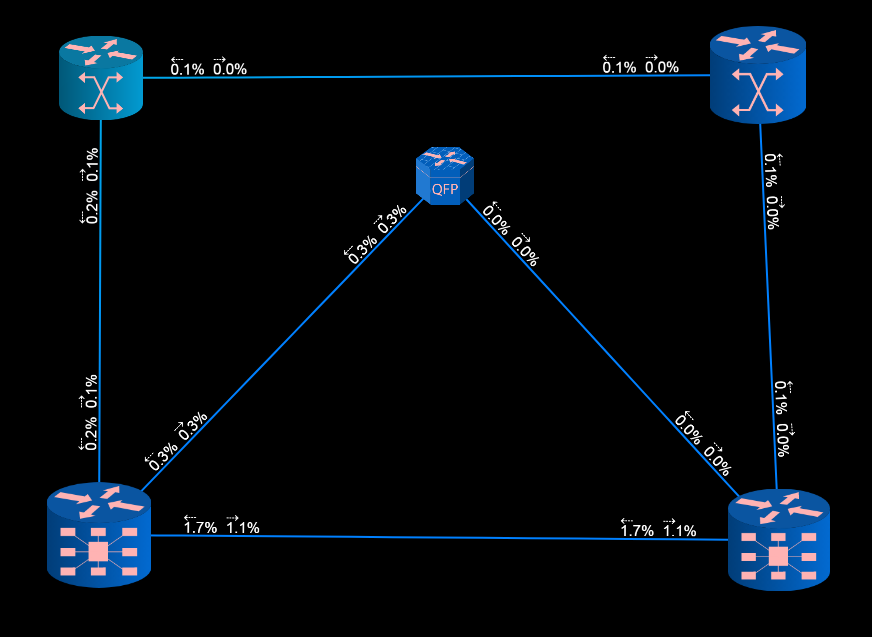
This is an example of how Nectus  overlays real-time performance data on top of network diagrams.


If you still using Visio for your network diagrams you are a dinosaur. You may be very good at it and have millions of very nice

looking stencils  but your network diagram becomes obsolete the moment  you finished working on it.

Network diagram made in Visio is what your think your network diagram looks like but not what it actually is.

Network changes every day, every minute, every second. Links goes down, IGP flaps, Spanning tree re-converges,  BGP Churns.

Can you see all of that in Visio? Does your network diagram shows all the the action?

Can you see traffic distribution among LACP bundle members right on your network diagram in real time?

Can you spot asymmetric routing when you looks at Visio?

Modern JavaScript opens doors to an unlimited opportunities to making great web-based network diagrams on demand with

all the real time information overlaid.

If your Network mapping software does not give you all of that may be you are not using the right one?

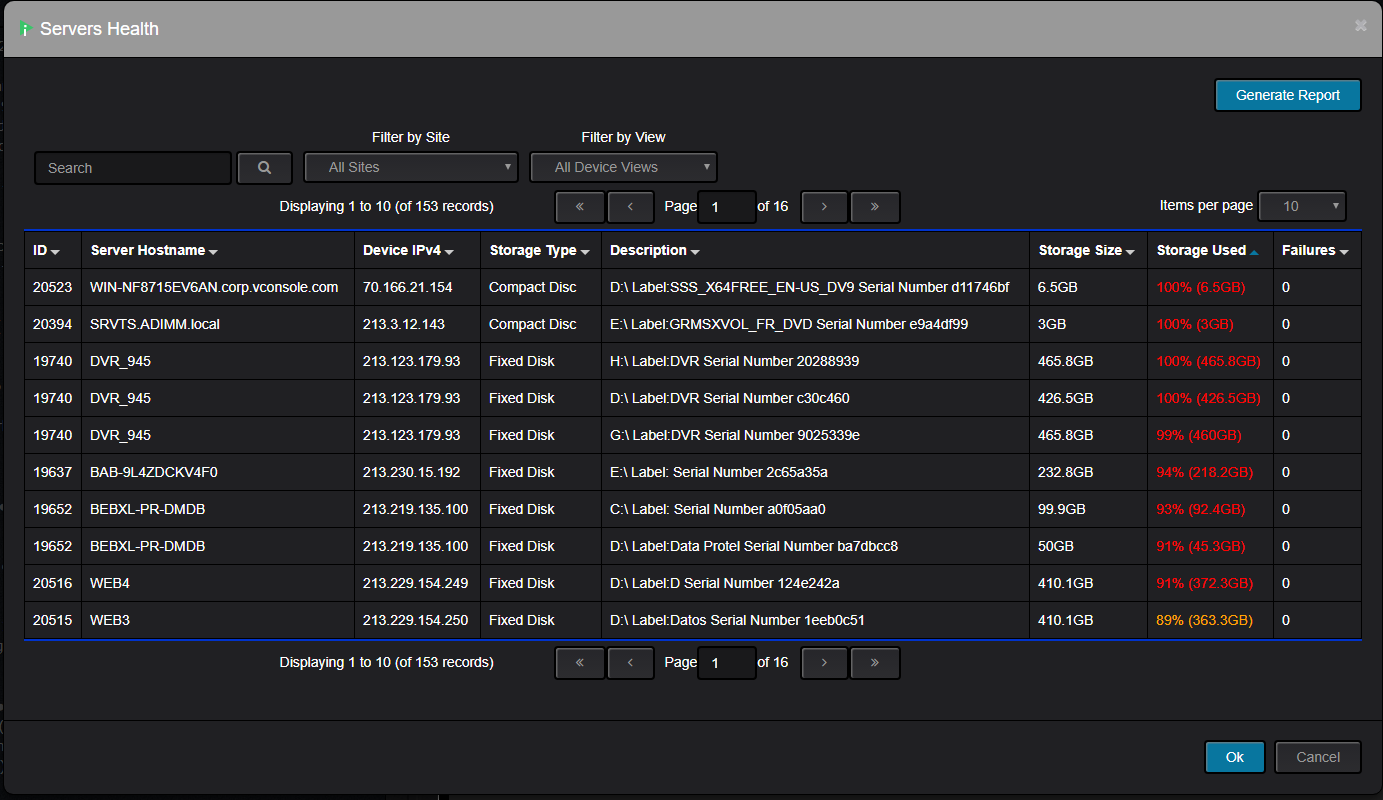
Starting from version 1.2.7 Nectus adds new “Storage and Memory Utilization” reports for Windows and Linux Servers (VMs or Standalone)

We can monitor and alert on: Low HDD free space, High RAM or High Virtual Memory utilization for any Windows/Linux Server.

Reports are based on SNMP hrStorageEntry OID (1.3.6.1.2.1.25.2.3.1)

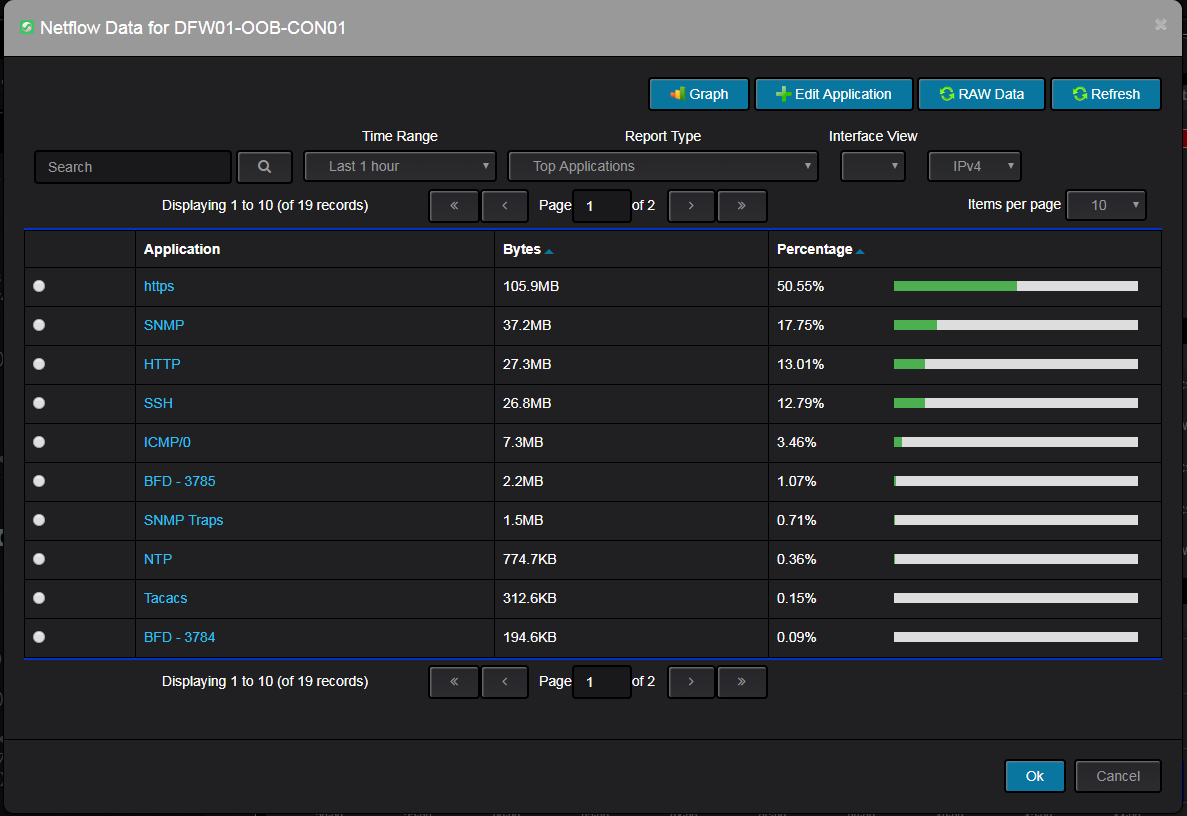
Following Netflow reports are available for all Nectus Suite users starting from version 1.2.6

  1. Top Flows by Protocols
  2. Top Flows by Application
  3. Top Flows by BGP AS Source + Destination
  4. Top Flows by BGP AS Source
  5. Top Flows by BGP AS Destination
  6. Top Flows by IP Source + Destination
  7. Top Flows by IP Source
  8. Top Flows by IP Destination
  9. Top Flows by Source Countries
  10. Top Flow by Destination Countries

All reports are supplied with  IP Geolocation information. Netflow collector is a licence free component of Nectus suite.

Supported Netflow formats: V5, V9, IPFIX

Max number of flows per second: 30,000

Netflow collector runs on a dedicated VM or standalone server with following recommended specs:

OS: Windows 64 Bit

RAM: 32GB+

HDD: 1TB SSD

You can clone network topology diagram to multiple windows for up to 5 x 5 grid  an overlay different information in each cell


It is important to distinguish between monitored device “down” event and event when monitoring application itself loses network connection.

When network monitoring application itself losses network connectivity it should not result in alert emails or text messages with monitored device

down events as it would be classified as false positive alerts.

To monitor its own network connectivity Nectus Server uses default ICMP probe for its default gateway with an inter- packet delay 3x faster

than normally used for monitoring all the devices. This allows Nectus monitoring service to detect loss of network connection faster than any of the normal device probes

would return “device down” alert.  If Nectus server detects that it lost network connection it stops all monitoring activity for 5 min.

Here is the list of the the possible reasons why some of the network devices can be missing after Network Discovery:

  1. SNMP is not configured or misconfigured  on missing device (Test SNMP operation via Tools -> SNMP Walk).
  2. SNMP ACL on missing device does not permit requests from Nectus IP Address  (Test SNMP operation via Tools -> SNMP Walk).
  3. IP address of the missing network device is outside of the range of configured subnets in Network Discovery and CDP is disabled on missing device.
  4. IP address of the missing network device is outside of the range of configured subnets in Network Discovery and device is located inside isolated CDP domain.
  5. There a Firewall between missing device and Nectus and it block ICMP and /or SNMP traffic.

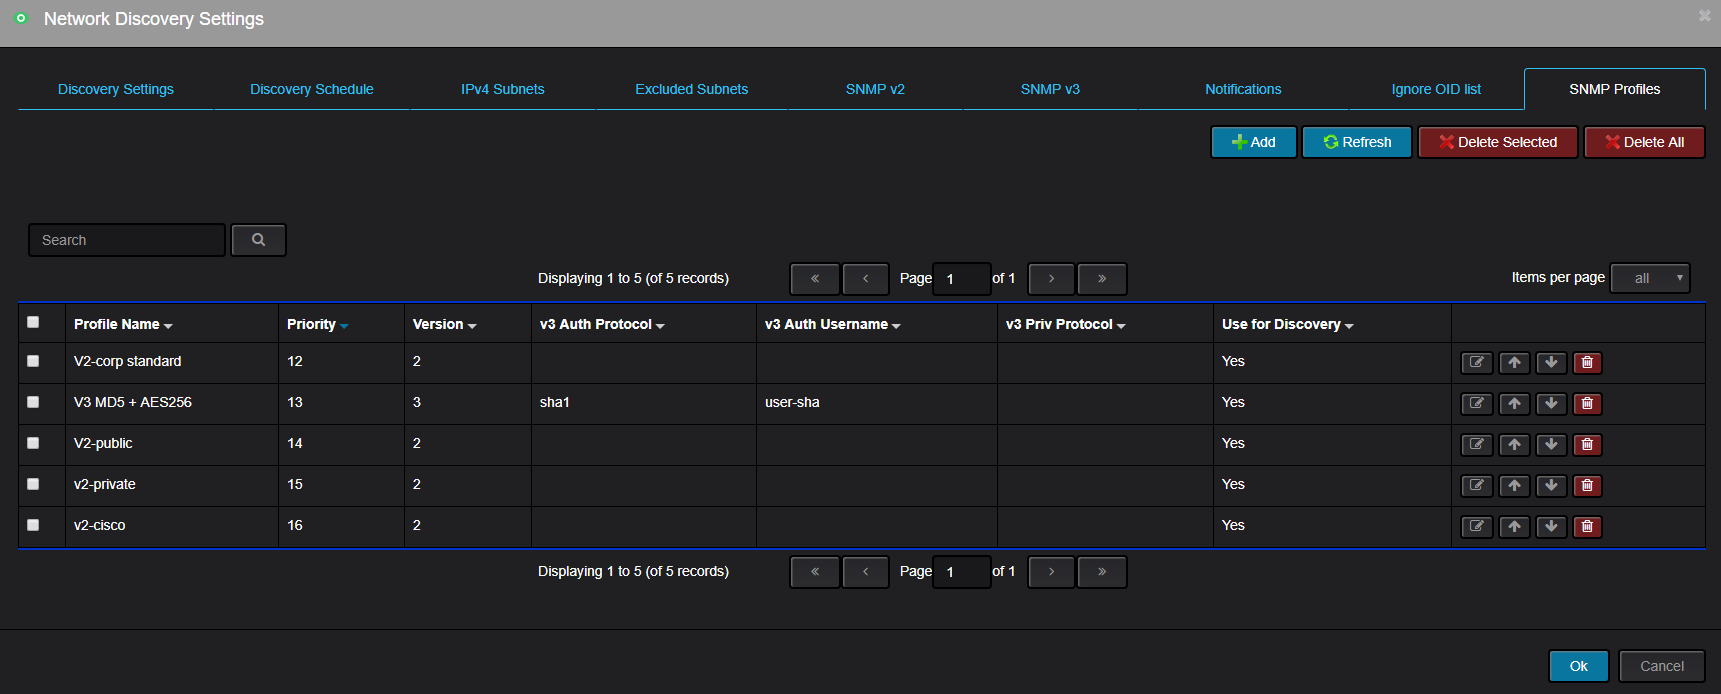
During installation user must provide a standard corporate SNMP v2 or v3 Read-only credentials to be used for network discovery.

For each live IP address Nectus tries to use standard SNMP parameters as a first choice  but in addition to standard credentials Nectus attempts

to use some of the well-known SNMP strings such as v2 community “public”, “private”, “cisco”, etc.

This approach helps to find  rogue or misconfigiured devices that would normally be left undiscovered and pose a potential security issues.

To manage list of  “well-known” SNMP profiles go to “Settings -> Network Discovery Settings”.

Platform_id Product_name Product_category
.1.3.6.1.4.1.2496.1.1 Cisco PGW 2200 Softswitch Cisco Protocol Gateways
.1.3.6.1.4.1.4413.2.1.6 Motorola Surfboard SBG6580 Cable Modem and Wireless Router Motorola Cable Modem and Wireless Routers
.1.3.6.1.4.1.99.1.1.3.34 Cisco Virtual PSTN Gateway Cisco Virtual PSTN Gateways
.1.2.826.0.1.4616240.1.1.4515 Cisco TelePresence MCU 4515 Multiparty Conferencing Unit Cisco TelePresence MCU 4500 Series Video Conferencing Units
.1.2.826.0.1.4616240.1.1.4505 Cisco TelePresence MCU 4505 Multiparty Conferencing Unit Cisco TelePresence MCU 4500 Series Video Conferencing Units
.1.2.826.0.1.4616240.1.1.4501 Cisco TelePresence MCU 4501 Multiparty Conferencing Unit Cisco TelePresence MCU 4501 Series Video Conferencing Units
.1.2.826.0.1.4616240.1.1.4210 Cisco TelePresence MCU 4210 Multiparty Conferencing Unit Cisco TelePresence MCU 4200 Series Video Conferencing Units
.1.2.826.0.1.4616240.1.1.4205 Cisco TelePresence MCU 4205 Multiparty Conferencing Unit Cisco TelePresence MCU 4200 Series Video Conferencing Units
.1.3.6.1.4.1.9.1.2141 Cisco cBR-8 Converged Broadband Router Cisco cBR Series Converged Broadband Routers
.1.2.826.0.1.4616240.1.1.4220 Cisco TelePresence MCU 4220 Multiparty Conferencing Unit Cisco TelePresence MCU 4200 Series Video Conferencing Units
.1.2.826.0.1.4616240.1.1.4510 Cisco TelePresence MCU 4510 Multiparty Conferencing Unit Cisco TelePresence MCU 4500 Series Video Conferencing Units
.1.2.826.0.1.4616240.1.1.4215 Cisco TelePresence MCU 4215 Multiparty Conferencing Unit Cisco TelePresence MCU 4200 Series Video Conferencing Units
.1.2.826.0.1.4616240.1.1.4203 Cisco TelePresence MCU 4203 Multiparty Conferencing Unit Cisco TelePresence MCU 4200 Series Video Conferencing Units
.1.3.6.1.4.1.9.1.2008 Cisco C897VA Integrated Servises Router Cisco 890 Series Integrated Services Routers
.1.3.6.1.4.1.9.1.2229 Cisco C841M-4X Integrated Services Router Cisco 800M Series Integrated Services Routers
.1.3.6.1.4.1.9.1.973 Cisco UC520-S8-U2-BRIWK9J Switch Cisco 520 Series Switches
.1.3.6.1.4.1.9.1.888 Cisco UC520-M48-U12-FXO Switch Cisco 520 Series Switches
.1.3.6.1.4.1.9.1.2250 Cisco Aironet 1850 Access Point Cisco Aironet 1850 Series Access Points
.1.3.6.1.4.1.9.1.931 Cisco RF Gateway 10 Cisco Universal Edge QAM
.1.2.826.0.1.4616240.1.1.4520 Cisco TelePresence MCU 4520 Multiparty Conferencing Unit Cisco TelePresence MCU 4500 Series Video Conferencing Units
.1.3.6.1.4.1.9.1.594 Cisco 1718 Router Cisco 1700 Series Routers
.1.3.6.1.4.1.9.1.1860 Cisco C891FW Integrated Services Router Cisco 890 Series Integrated Services Routers
.1.3.6.1.4.1.9.1.1056 Cisco SM-X Layer 2/3 EtherSwitch Service Module Cisco EtherSwitch Modules
.1.3.6.1.4.1.9.1.1397 Cisco 881 Integrated Services Router Cisco 880 Series Integrated Services Routers
.1.2.826.0.1.4616240.1.1.8510 Cisco TelePresence MCU MSE 8510 Multiparty Conferencing Unit Cisco TelePresence MCU MSE Series Video Conferencing Units
.1.3.6.1.4.1.11829 Corvil CorvilProbe CNE5100 CorvilNet Engine Software Corvil CorvilProbe CNE5100 CorvilNet Engine Software
.1.3.6.1.4.1.9.1.1384 Cisco C819 Integrated Services Router Cisco 819 Series Integrated Services Routers
.1.3.6.1.4.1.9.1.1854 Cisco C886VA Integrated Services Router Cisco 880 Series Integrated Services Routers
.1.3.6.1.4.1.9.1.2058 Cisco 887VA Integrated Services Router Cisco 880VA Series Integrated Services Routers
.1.3.6.1.4.1.9.1.1746 Cisco VG202XM Voice Gateway Cisco VG Series Gateways
.1.3.6.1.4.1.9.1.1882 Cisco Catalyst 3650-48TQ-E Switch Cisco Catalyst 3650 Series Switches
.1.3.6.1.4.1.9.1.2230 Cisco C841M-8X Integrated Services Router Cisco 800M Series Integrated Services Routers
.1.3.6.1.4.1.9.1.2130 Cisco Catalyst 3560CX-8PT-S Switch Cisco Catalyst 3500 Series Switches

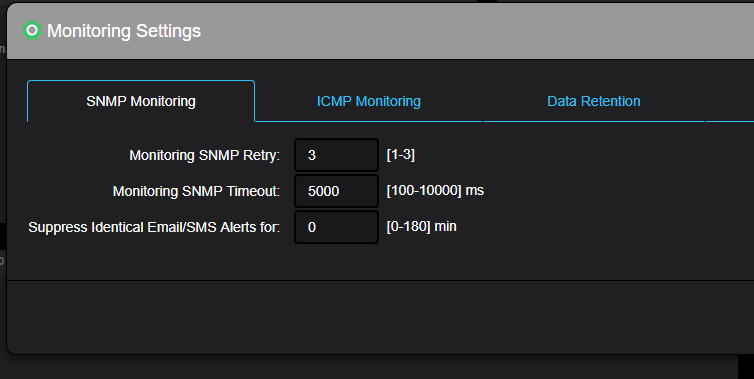
One of the first steps that we normally perform during POC is timer tuning for ICMP and SNMP for Discovery and Monitoring services.

Normally Discovery should have different timer values than Monitoring because Discovery operates in a “pessimistic” model when IP address

that is being probed by Discovery engine is likely not to be alive or  not to respond to SNMP therefore timeoute values and retry counts has to be very aggressive

for example 100 ms Timeoute with 2 Retries  for ICMP is normally sufficient. SNMP timer for Discovery have typical values of 1000ms and 1 retry.

Aggressive Discovery timers also reduces amount of traffic being generated and make discovery jobs run faster.


Monitoring Service timers are in opposite spectrum,  as Monitoring service operate in “optimistic” mode where it expects for all devices that are enabled for monitoring

to respond and timers has to be tuned to maximum wait time with ICMP timers as high as 300ms and SNMP timers as high as 5000 ms to support bigger/busier devices like Nexus 7018.


Nectus Network Discovery engine is one of the fastest among all that I worked with .. and I worked with most of them

(Cisco Works, Prime, Solarwinds, ManageEngine, Remedy, BMC)

I remember when it took Cisco Prime to scan 10.0.0.0/8 whooping 24 hours. Nectus finishes 10.0.0.0/8 in under 3 hours.

Speed of the discovery is very important quality as it minimizes impact on your network and allows you to schedule Discovery jobs in very

specific and narrow windows on weekends or during night times.


I am inviting users of other tools to post their Discovery times for 10.0.0.0/8 ..   there has to be some other good tools out there..

One of the unique features of Nectus Syslog service is ability to alert users via Email or Text messages not only

on Syslog message Severity level but on specific keywords inside Syslog message. For example you can configure a rule

to alert via email when there is Syslog message with Severity 2+ and there is string “VPC Peer-Link” inside Syslog message body,

limiting your alerts to only syslog messages related to VPC Peerlinks. You can configure multiple keywords with Alerts going to

different recipients, so the Server team receives the Server specific keywords and Network Team receives the Alerts about

those ugly green boxes locked in MDF closets.

I was working with a client today on Nectus POC and he asked me to generate a list of all the routers and switches that have problems with TACACS.

Nectus didn’t have “out of the box” report that validates the SSH connection to each device so we had to be creative in this case.

Fist we enabled AAA integration on Nectus  (Settings ->General Settings ->AAA Integration) and configured Tacacs credentials (username/password)

so it can open SSH sessions to devices.

Next step was to enable  “Configuration Backup” Feature in “Settings -> Device configuration Backup” and start the config backup job one time manually.

In 15 min we had a list of all devices where config backup failed, so we exported it to CSV and client got what he wanted.  Piece of cake.