When it comes to Network Discovery we are absolute market leaders and can determine router model by the sound of its Fan. Just kidding..

But here is how we actually do it.

Let say IP address 10.20.45.1 is alive and we need to determine what type of device this is.

Step 1: Perform SNMP Get operation for sysObjectID.0 (1.3.6.1.2.1.1.2.0)

snmpwalk -v2c -c public 10.20.45.1 sysObjectID.0

This OID stores platform specific string which suppose to be unique for each device type.

For example device responds with: .1.3.6.1.4.1.9.1.924

This string is called Platform Specific OID and contain Vendor code in seventh position.

Each vendor has IANA assigned unique number listed here https://www.iana.org/assignments/enterprise-numbers/enterprise-numbers

In our case code is “9” which means that this is a Cisco device.

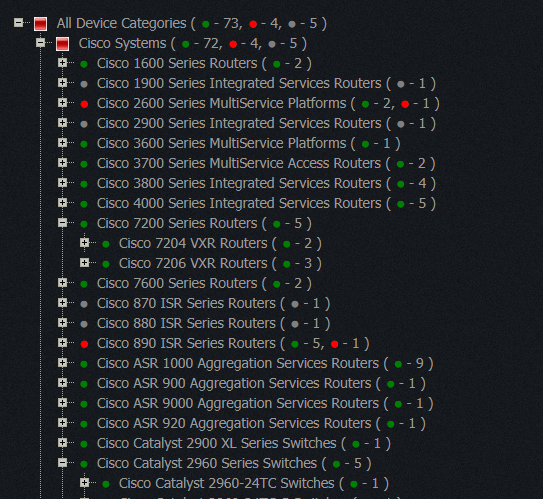
The remaining numbers define platform info and that information is collected from MIB files published by each vendor which we all collected and combined into a single repository of 1200 vendors which contains now around 56,000 different platform OID which we all classified by Device Category and Model.

At the end we have very nice device classification tree like this


In this article we will see some of the features of Nectus that can enhance the Virtual Internet Routing Lab (VIRL) experience.
VIRL is Cisco’s network simulation platform where you can run Cisco OS (IOS, IOS XE, IOS XR, NX-OS, ASA) virtual machines and other third party virtual machines (this includes Linux servers, traffic generators and other networking vendors virtual machines) to build topologies for feature testing and validation before introducing them in production.

We will explain some features of Nectus that can complement VIRL to help you visualize better your network.

This is the VIRL topology that will be used:

The devices were started with some predefined configuration that included interface IP configuration, routing protocols (EIGRP, BGP).
VIRL topology is using shared flat network so that each device will get an IP address from 172.16.1.0/24 network on their GigabitEthernet0/0 interface as their management IP address.

Nectus was installed on a Windows 2016 server that was acting as an OpenVPN client connecting to VIRL server which means that it received an IP address from the range 172.16.1.20 – 172.16.1.39, thus making the Nectus and the VIRL routers to be in the same subnet.

Once Nectus starts discovering the devices from 172.16.1.0/24 subnet (as per discoverable subnets configured on Nectus), it builds a list with them categorizing them based on the vendor, type of the device, model of the device.

Based on the information collected through SNMP, Nectus can build L2 and L3 topologies.

This is the L2 topology:

And this is the L3 topology:

One interesting feature that Nectus can do is to give you a visual result of the path between two points in the network.
This is called L3 Path Discovery (for now only available for IPv4). Source IP, source router and destination IP are the input values:

And the result looks like this:

The interesting part is that it can discover asymmetric paths in the network to give a better understanding about how traffic flows in the network.
Another interesting set of features is that you can get real time graphs with the some of the characteristics of the interfaces (utilization, availability, errors, dropped packets, traffic volume).
This is how you can select any of the graphs. This is for utilization:

And the graph looks like this:

Observe that although on when we selected the link that appear to be between R5 and R4, it is actually between R5 and SW2.
The errors graph shows how many RX and how many TX errors are on interface basis:

You can have a consolidated view of the top most utilized interfaces or the interfaces that have the most errors.
By default, there are few network monitoring dashboards (you can create your own to better accommodate your monitoring needs).
The high level dashboard gives you the top interfaces with regards to various interface statistics:

From here, you will get the the list of interfaces:

Nectus can trigger alerts based on any of these interface characteristics.
For testing purposes, the threshold level for interface utilization at which the alarm is triggered was configured at 1%.
Using ping command (between R4 and R5, therefore through SW2), the interface utilization was around 870Kbps and after changing the bandwidth of the interface to 10Mbps

(adding bandwidth knob under interface configuration), this 870Kbps turned out to be around 8.5% interface utilization which means that the alert should have been triggered.
After some time, the graph is adjusted with the new value:

The alerts log shows these type of alerts:

And in this interface utilization, this is the alert:

Another useful information that can be retrieved directly from Nectus using the interface graphs is the interface availability that can quickly give some hints about service interruption.
The graph is selected from the link menu:

And it should show the state of the interface:

Coming back to the default network monitoring dashboards, the information that an interface that is down is captured by both default dashboards. This is the low level dashboard:

As well by the high level dashboard:

Again, there is an alert sent for such events:

There is a history kept for each outage of the interfaces showing for how long the interface was down:

Going further graphs for interface errors and dropped packets are useful to troubleshoot network performance.

And for dropped packets:

Coming back to alerts, Nectus can monitor the CPU usage and trigger alerts as required.

The Device Info menu contains among other CPU usage graphs.

If the CPU usage goes above the threshold, not only you will see this on the graph, but it will also trigger an alert:

Another interesting feature that can help you quickly find all sort of information about the devices in your topology is the Composite Search feature:

It can find various information and for instance, I would like to find where is this IP configured:

And the result is this:

Lastly, one feature that can improve VIRL usability is that Nectus can show on the topology that a link is down

(after the link was shutdown from CLI or went down for other reasons like err-disable).

Suppose you do this on CLI:

R4(config)#int gi0/2
R4(config-if)#shut
R4(config-if)#
*Dec 29 17:35:29.750: %DUAL-5-NBRCHANGE: EIGRP-IPv6 1: Neighbor FE80::F816:3EFF:FE84:2418 (GigabitEthernet0/2) is down: interface down
*Dec 29 17:35:29.752: %DUAL-5-NBRCHANGE: EIGRP-IPv4 1: Neighbor 10.0.128.2 (GigabitEthernet0/2) is down: interface down
*Dec 29 17:35:31.725: %LINK-5-CHANGED: Interface GigabitEthernet0/2, changed state to administratively down
*Dec 29 17:35:32.725: %LINEPROTO-5-UPDOWN: Line protocol on Interface GigabitEthernet0/2, changed state to down
R4(config-if)#

Then the link will blink on the topology, while VIRL will not show anything with regards to the fact that the interface between the VMs is down:

The up/down status can be enabled from the device settings like this:

Throughout this post, various features of Nectus have shown how Nectus5 can bring value to topologies running in Cisco VIRL.
Of course the same features can be used to know your real/production network better, but it is good to know that you can use Nectus5

to monitor your proof of concept network deployed in VIRL.


On every Nectus installation that we conducted I noticed that on average each company has around 10% of network devices that are configured with well-known snmp v2 community strings: public/private.

This is as bad as using “cisco/cisco” as your SSH credentials. That is major security loophole as even read-only string “public” gives possible attacker complete view of the devices’ routing table, interface descriptions, interface IPs, device S/N, list of CDP neighbors with their IPs.

It is fairly easy to discover these devices by adding secondary SNMP profile to your favorite NMS and checking if there is a sudden spike in number of discovered devices.

Problem is so wide-spread that we added discovery of these devices to be a part of standard Nectus network discovery routine.

SNMP v3 does not have this issue as it has way more parameters that has to be configured, plus it gives  access to strong encryption, but for some reason adoption rates for SNMP v3 is low comparing to SNMP v2.

To keep a good track of your network it is necessary to have a network diagram of your topology so you can know for sure where each device is located, where it is connected and in case there is a failure in your network it is easier to find the devices affected.

You can create your own topology and add each device manually even though that may take a lot of time depending on the size of your network and every time a new device is added to the network, you must add it to your topology manually. Sounds like a lot of work.

Luckily with Nectus this process can be avoided! Nectus can generate Layer 2 and Layer 3 topologies in just one click and if a new device is added to your network, it is added automatically to your topology.

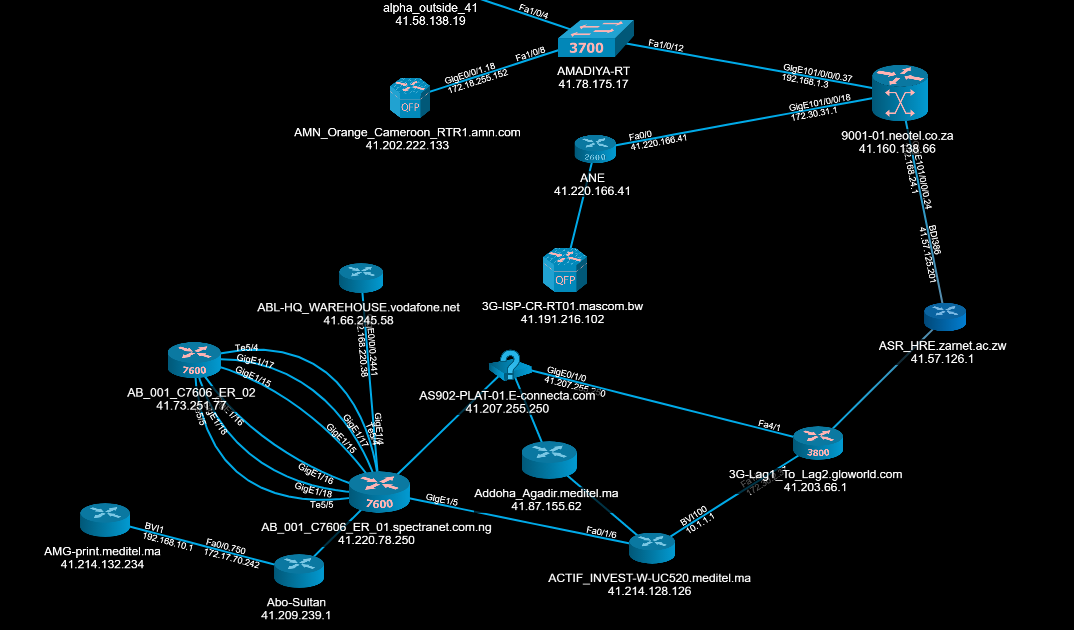
This is how your topology would look like:

And once your topology is ready you can perform various actions to get live stats of your network’s performance and usage such as:

  • Show graphs of all basic metrics for each interface: utilization, errors, dropped packets, availably and traffic volume.


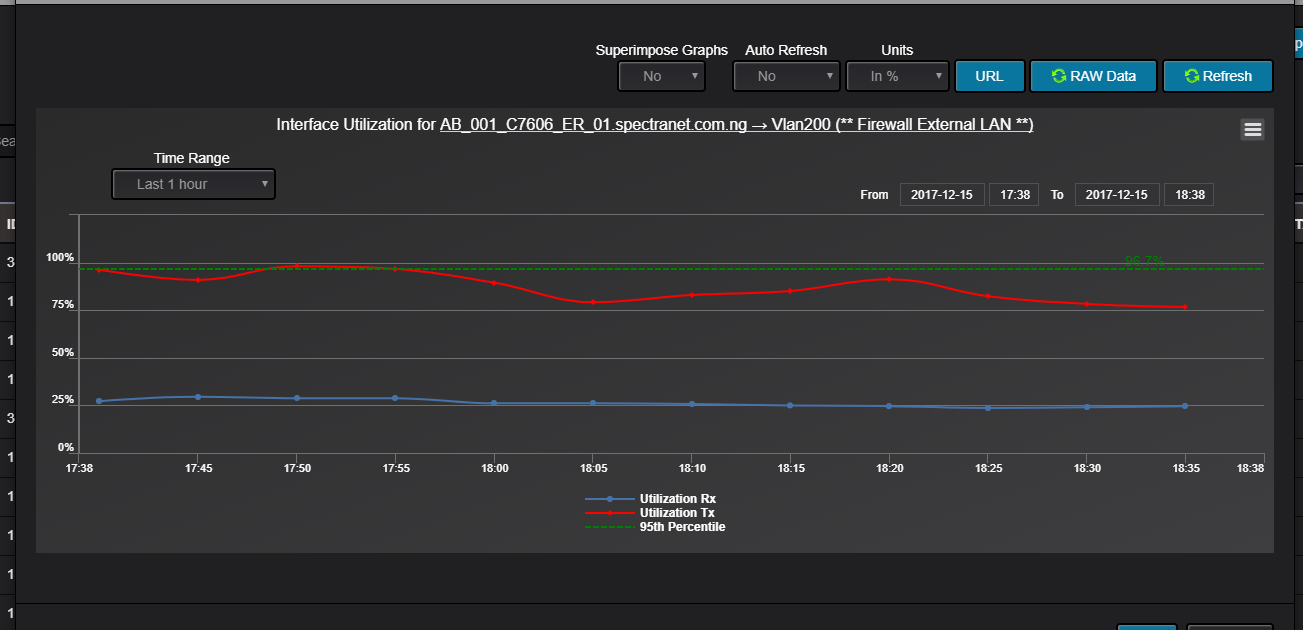
Here is an example of an Interface Utilization Graph:


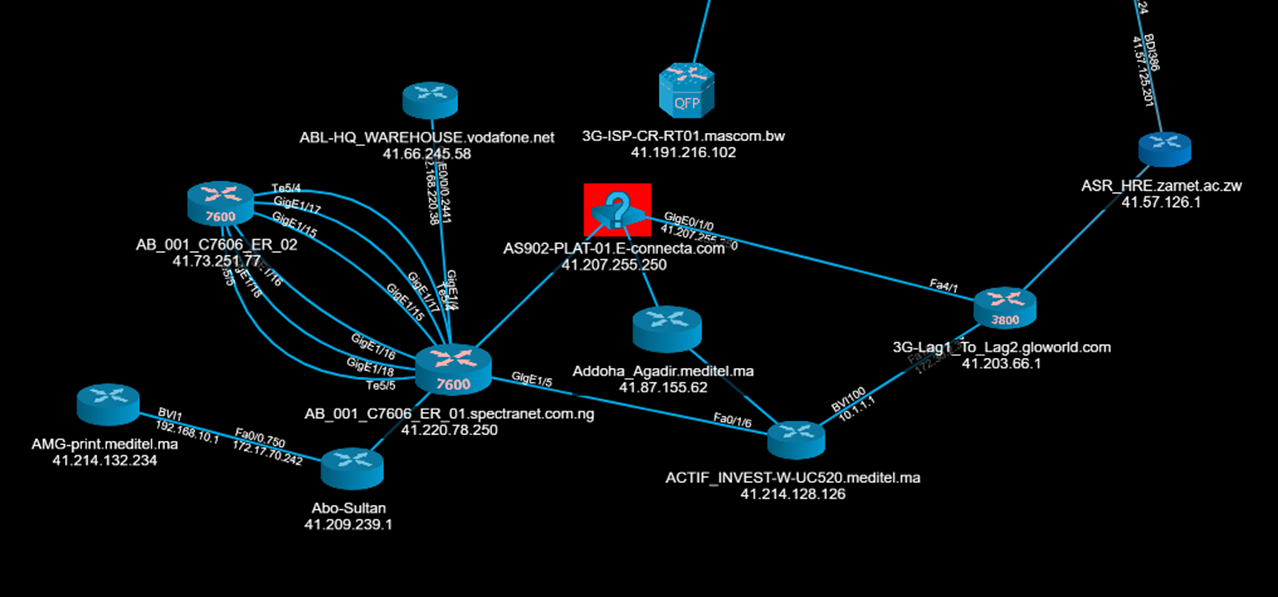
  • Show interface and device availability status. If an interface or device goes down, it will generate and alarm sound and show red blinking color directly on Topology screen.


Here is how it would look like if a device went down:


  • User can interact with topology via device and links context menus and generate reports directly from Topology GUI.


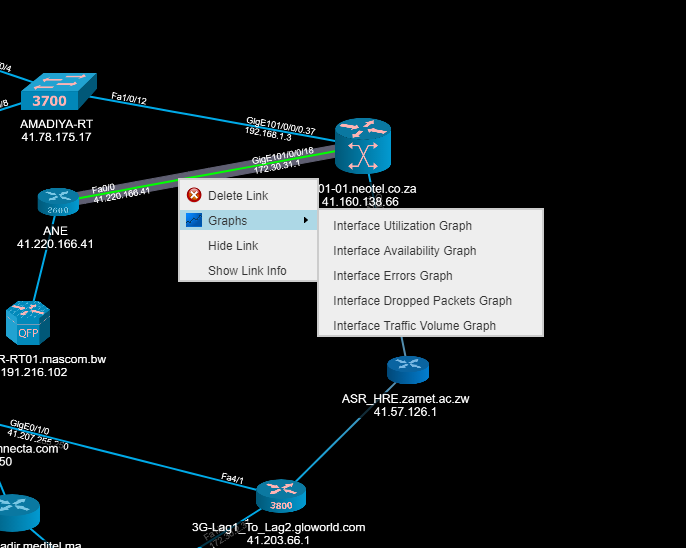
With just one click users can generate graphs to monitor a link’s performance and show link info as pictured below:


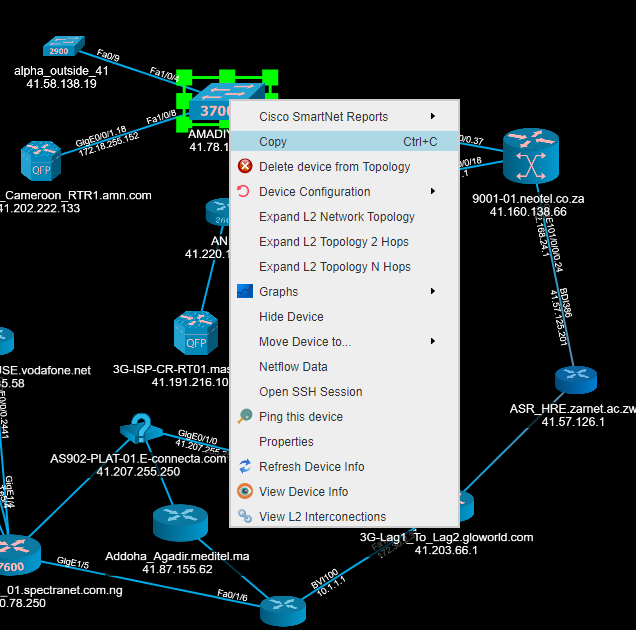
Users can see real-time performance graphs from each device on the network, show device basic info, ping device from browser, start an SSH session and generate Cisco SmartNet reports directly from the topology by just right clicking on any device.


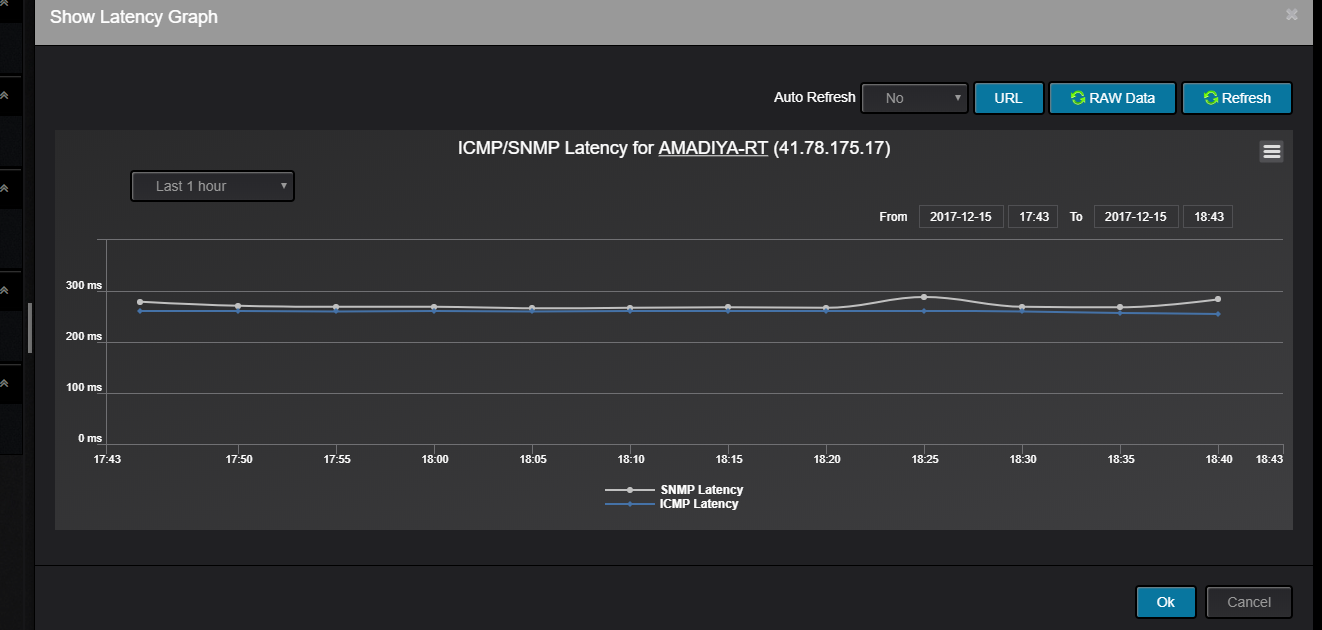
This is an example of latency graph for single device:

Nectus offers new way to create and keep up to date your network topology, making your network topology live and interactive.

It keeps track of all performance metric and displays is directly on topology with all its real-time stats, making it easier and faster to detect a failure and correct it.


Download your 60-day evaluation

Well, if you are reading this article you probably know what NetFlow is and how much data it can generate. 100GB of NetFlow records per day is not something totally unusual in NetFlow business.

We tried most of the commercial and open-source existing database engines like Microsoft SQL Server, MongoDB, PostegreSQL, MySQL or even Oracle and were not happy with results.

We tried turning off all the indexing, implemented daily partitions,  decided not to store some less important NetFlow fields  and may be even

upgraded your storage to those fancy M2 SSD and still NetFlow reports took minutes to appear.

If your NetFlow rates are somewhere under 1,000 flows per second you can skip this reading, pick any  DB and it will produce acceptable results.

Problems becomes visible when your flow rates  reaches 2,000 fps and at 10,000 fps just doing INSERT to your tables takes 70% of the time.

10,000 flows per second produces 600,000 database records every minute and only INSERT statement takes around 40 second to process leaving only 20 seconds of

available time  for any reports to be generated. The main problem here is that conventional DB engines are not optimized for storing read-only sequential data such

as time based event logging or NetFlow. Best database engine for Netflow has to be designed with read-only sequential access in mind, no “Delete-Update” functionality is required for NetFlow.

This restriction allows great simplification of DB internal formatting structure  and processing logic. Second DB feature that best suited for NetFlow is reduction of possible Indexes to one.

There is absolutely no value in having indexes for Source/Destination IP addresses or Source/Destination ports as those indexes only benefit single type of NetFlow report

and each index will double your table size on disk. The only Index that is used in all reports is Index by flow time stamp as all NetFlow reports are focused on very specific time frame.

And last but not least DB feature that is required for perfect NetFlow storage is hardware optimization. Allocating each DB thread to a dedicated CPU core  has shown

to increase query processing time by 10x.

When  developing our own NetFlow collector we tried all well-known DB engines with one performing slightly better than others but none of them were able to support the golden standard of 30Kfps.

This was until we met the ClickHouse, open source DB engine developed by Yandex. ClickHouse has a long list of limitations, but those limitations are implemented with

a single purpose to have the fastest logging DB engine available on the market. With a help of ClickHouse Nectus can process 50,000 flow per second in single VM which  is currently

a record among all commercially available NetFlow collectors.

Download your 60-day Trial of the best NetFlow collector.


Most of the enterprise grade monitoring tools allow predefined thresholds to be set for specific monitoring parameters such as interface utilization,

RAM utilization or percentage of free TCAM available on switches. When a specific metric exceeds a predefined threshold you will receive an email alert, text message, or…

a phone call from your manager.  Likely those thresholds are tuned to a higher side to prevent false positives or filter out the events with a short duration.

But in any case alerts will be sent after critical conditions have already occurred and damage has already been done. This approach is called reactive network monitoring

and it has its value. But what if you can get an alert before critical conditions actually happen?  Nectus NMS is a pioneer of next-gen proactive monitoring and in selected

case-studies it demonstrated an ability to forecast critical operational conditions up to 1 week in advance with 95% accuracy.

Nectus analyses historical daily, weekly  and monthly fluctuations of network operational metrics such as traffic volumes, interface utilization and extrapolates it

based on polynomial curves for next 7 days. This advanced mathematical approach demonstrated 95% accuracy in prediction of critical operational

conditions for next 7 days and 80% accuracy for next 30 days.

The more time you have before operational conditions actually reach critical thresholds, the more options you  have to fix it before it impacts production.

Download your 60-day evaluation copy of Nectus

Next Generation of Network Discovery and Monitoring Tools

There are many reasons why your network needs to be monitored. It is essential to any network administrator to keep track of the network’s performance and usage in real time and to detect failures, slowness or any other threat that could be affecting the network. Every device that is added to the network, every change in the topology or any failure needs to be immediately detected. That is why we need a network monitoring software to make the best of our network and that is exactly what Nectus is for.

Nectus is a network discovery, monitoring and visualization software and its main role is to discover network topology, generate a visual network diagram and keep it up to date, detecting any failure or unusual behavior that could be affecting the network and alerting the network administrator immediately.

These are the Nectus key features:

  • Automatically discovers connections between devices (via Cisco Discovery Protocol) and stores all this connections in a Database.
  • Network discovery is run everyday and if any new device has been added to the network, the topology is updated automatically so network diagrams will always be up to date, no need to do it yourself so you will be saving your time. You can generate L2 and L3 network topology in just one click, way better than Microsoft Visio!
  • Real time monitoring is overlaid on top of network diagrams. You will be able to see utilization, errors and dropped packets or up/down status directly on your diagrams.
  • Automated configuration backup and configuration changes for routers and switches along with best practice audits so you can find and fix misconfigured devices.
  • Includes free integrated NetFlow collector.
  • Syslog Server: Store unlimited number of Syslog messages.
  • URL Monitoring: Monitor UP/DOWN and latency for any URL.
  • Track configuration differences. Easily find differences in configurations before and after the change.
  • Layer 3 Traffic Path Visualization: See how packets travel from A to B.

If you are looking for a software to keep your network in a best shape, then Nectus is your best choice!

You can download a 60 days fully functional demo at https://nectus5.com/download/ and try all these features yourself.


Implementing company-wide standards for interface description strings in routers or switches should be a top priority for all network engineers.

Well defined and structured description strings helps with automation for the most tedious and boring manual steps associated with deployment, configuration,

monitoring and decommission of any network connections. Network interface descriptions should include some of the following information elements encoded with special characters

that allow easy parsing by scripts, network management tools and makes easy for human eye to spot any problems during troubleshooting sessions.

Here is the sample naming format and structure that we normally recommend  and that is easily integrated with Nectus NMS parsing scripts.

  1. Link Type.  Example of 3 characters link type encoding  can be: BBN – Backbone, TRL – Internet Transit,  OOB- Out of Band, UPL – Uplink, DCI – DC Interconnect…
  2. Connected Device name. Name of the remote device connected to this link.
  3. Status. T – Testing, D – Decommed, P – In Production
  4. Telco provider’s name : LVL3 , ATT, VRZ, ABN, TELIA, XO.. etc
  5. Telco Circuit ID
  6. Phone number to call in case of the outage.

Usage example:

interface TenGigabitEthernet 1/5

description DCI#P#ATT#T4/HCGS/831899/SC#1-800-456-5672


We are proud to announce that our next Nectus release will include the most powerful and feature rich telco circuit management platform available on the market today.

Nectus CircuitDB provides a central repository of all of your circuit contracts and provide reminders well before contract expiration times so you can renegotiate better prices with your telco provider.

Circuit DB is fully integrated with Nectus Network Discovery and Monitoring module which allows you to map Circuit ID directly to specific router interface and get real time visibility of  circuit UP/DOWN status.

Nectus can send email alerts directly to telco support in case of specific circuit is Down or automatically open support cases on telco portals ( with selected number of telco providers).

Nectus CircuitDB can calculate circuit UP time based on Monitoring statistics provided by core Nectus NMS to verify contracted SLAs.

Combined with automatic Network Topology generation that shows where specific circuit is located Nectus CircuitDB is a core tool for all network engineers and procurement experts.

CircuitDB gives ability to track of all the telco circuits (Internet, MPLS, T1 etc), carrier contracts, cabinet/rack/patch panel information.

Support for configurable email alerts on approaching circuit contract renewal dates, integration with real time circuit monitoring.

Never pay for circuits that not being used and  many more cool features.


Here is the most complete list of features available for Nectus customers

FeatureComments
Network Monitoring ICMP, SNMP v2c and v3
Network Discovery1200+ platforms
Netflow CollectorSupport for v5, v9, IPFIX Netflow
Command ScriptingAutomate Config changes to routers and switches
Configuration BackupConfiguration backup for routers and switches
Basic Server MonitoringSNMP and WMI
SQL Server Monitorng50+ SQL related metrics
Network Topology VisualizationAutomatic L2 and L3 topology generation
Syslog Server Store unlimited number of Syslog messages
SNMP TrapsProcess incoming SNMP traps
GSM based alertingReceive Alert notifications directly to your cell phone
Email based alertingReceive Alert notifications directly to email
URL MonitoringMonitor UP/DOWN and latency for any URL
Configuration DiffsEasily find differences in configs before and after the change
L3 Traffic Path VisualizationSee how packet travels from A to B
MAC Address searchEasily find MAC address in your network
Web based SNMP Walk Utility
Web based Ping plotter Up to 10 IP Addresses
Web based SSH clientSSH to any device from your browser
LDAP Integration
Custom Dashboards
SmartNet verification for any device
Multiple SNMP profilesSupport for different SNMP parameters


One of the biggest challenges with SNMP v3 deployments in diverse environments is a lack of consensus

among hardware manufactures on what set of Privacy Ciphers has to be supported/included in standard SNMP v3 stack.

Even Cisco was unable to unify list of supported v3 Ciphers in different product lines (ASA vs NX-OS vs IOS-XR).

Partially this was caused by the lack of RFC that defined AES-192 and AES-256 implementations  for SNMP v3 but this didn’t stop top-tier hardware

vendors from implementing  those Ciphers internally and partially it was  caused by slow v3 adoption rate that put very low pressure on hardware vendors.

In any case it is very unlikely that you will be able to pick single set of  SNMP v3 Authentication/Encryption parameters that will be supported on all of the devices

in a good sized enterprise network. This results in having to use and support different encryption ciphers in different devices and what most important this

will require your Network monitoring tool to support multiple SNMP profiles based on device type. Your monitoring tool has to discover what SNMP profile

is compatible with each device, “remember” it and only use compatible SNMP parameters when communicating with specific device.

Nectus is the only tool that was built from ground up with support for device specific SNMP profiles and it deploys patented discovery logic that allows it to match

compatible SNMP profile to each device in sub-seconds. Nectus supports up to 1000 SNMP profiles and used by multiple customers with 10K+ routers.

60 days Nectus Trial


We have had several customers (well, not yet customers) who are in network consulting business and who keep using Nectus as part of their Network Discovery service offering portfolio. They don’t buy the software , but only use it within the 60 days that we allow for free trial.

We are very happy to see that they depend on us and return to us again and again, even though they don’t buy it yet.

This is the best indicator that we did something right. There are several tools available on the market for Network discovery that offer Trials but they keep coming back to Nectus.

If you ever need to map your network, run a network discovery, create a complex network diagram, monitor Internet link utilization or SQL server metric feel free to download Nectus and use it for 60 days.

It is totally fine if you use it again and again without buying it .

Building relationships is as important as making sales.  We understand that CapEx may take some time.  We will be there for you.

Best Network Discovery Software in a Planet

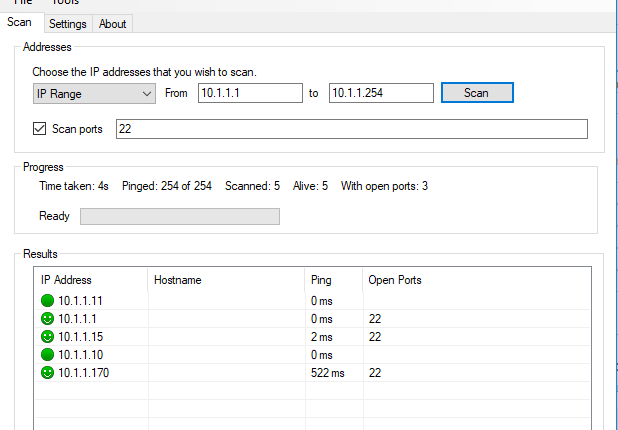
New version 3.2 of our famous Smiley IP Scanner application has been released.

It features improved user interface and faster more reliable operation.

Supports all modern Windows OS.

Scans for live IPs within specified range and checks for open TCP  ports for each live IP address.

Scans for open TCP ports even if IP address does not respond to Pings.  Export results to a CSV file.

Check for other useful apps in our  Network Engineer Goodies Box


When selecting specs for Nectus VM that will be used for Netflow collection storage we recommend following specifications:

RAM: Amount of RAM has to be not less that Netflow DB size growth in one week.

Example:  Your Netflow  storage grows by 10GB every day. Recommended RAM amount is 70GB

CPU: Number of logical cores has to be not less than number of Netflow senders

Example: You have 16 routers sending Netflow data. Nectus creates one thread for each sender so ideal CPU configuration is with number of logical cores not less than 16.

Storage: We only recommend dedicated SSD based storage with minimum 200,000 IOPS rating.   We had very good experience with PCI-E Intel Optane SSD.

With recommended specs we should be able to support  close to 30Kfps Flow rates

Download best Netflow collector


Very often I am invited to review new network related software products from other companies as an expert

in workflow and UI  optimization.  I always start with asking who designed the User Interface

and I see that in many cases user interface designer and a coder is the same person  and that where all the problems originate.

Golden rules of best software design:

User interface defines functionality so start with it.

User interface has to be designed by Subject Matter Expert not by a coder.

Person who designs UI may haven’t written a single line of code in his life, but he knows the work flow of the trade.

Start coding it only after UI is complete.

Additionally..

If you developing best Network Management software, SME has to get involved in DB design in very early stages:

It is Network Export who must decide how to call fields in SQL table that will be holding BGP session information not a DBA.

It is Network Expert who must decide how to call columns in JavaScript table that User will be seeing in reports not a Web designer.

It is Network Expert who has to check with C++ coder how he named those procedures that will be used to read ISIS peering info.

This may sounds like micromanaging, but this is what my 20 years experience in managing software development projects  tells me..

Download Best Network Management Software


One of the key features of Nectus is ability to get instant SmartNet validation for any piece of Cisco hardware  you have.

SmartNet validation is implemented via “Cisco Smart API” interface available for selected customers with SNTC (SmartNet Total Care) or

Partners with PSS (Partner Support Service) agreements.

Nectus SmartNet validation requires API account (Client ID and Client Secret). Contact your local Cisco rep to apply for one.

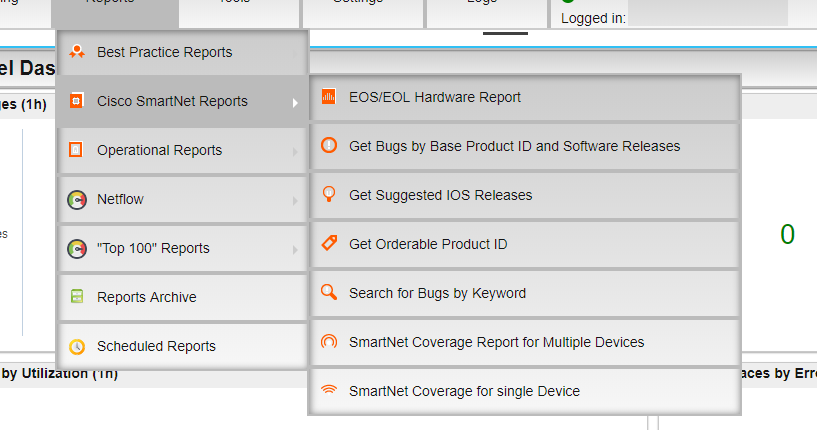
Following SmartNet reports are currently implemented in Nectus:

  1. SmartNet coverage status
  2. End of Sales Status
  3. End of Support Status
  4. Current list of Bugs for each platform + IOS combination
  5. Recommended version of IOS for each hardware platform

To access SmartNet reports to go “Reports -> Cisco SmartNet Reports” in Nectus GUI


Download Nectus 60 day trial

One of the limitations of VIRL that it does not provide real-time visual Up-Down status for Interfaces in your VIRL topology.

Pairing VIRL with Nectus give you best of both worlds. To allow Nectus to monitor your VIRL topology

enable and configure SNMP on your VIRL routers and ensure L3 reachibility  between your VIRL subnets and

Nectus Server IP address.   Define VIRL subnet in Nectus  “Settings” -> “Network Discovery”  and manually start discovery or

define discovery frequency which can be as low as every 6 min.  After Discovery finishes your should be able to see your VIRL topology in Nectus GUI.

Enable monitoring for Interfaces to allow Nectus to send SNMP polls every 30 sec to each virtual router’s interface.


Download 60 day Nectus trial


Nectus is licensed by module with the following modules available:

  1. Basic Network Monitoring
  2. Network Topology Visualization
  3. Wireless Monitoring
  4. AWS Monitoring
  5. Windows Server Monitoring
  6. Linux Server Monitoring
  7. NetFlow Collector
  8. Syslog Collector
  9. MS SQL Monitoring
  10. HTTP Server Monitoring
  11. Cisco SmartNet Reporting
  12. IPAM
  13. Configuration Backup and Management


Each module has different pricing brackets based on number of supported devices.

Annual Maintenance and Support is 20% of the license price.

Contact sales@nectus5.com for your personal quote.

First Year Support is free.

Download 60 day trial