After support for wireless devices was added in Nectus, specific monitoring dashboards were created to track any change that can affect the wireless users, controllers or access points.
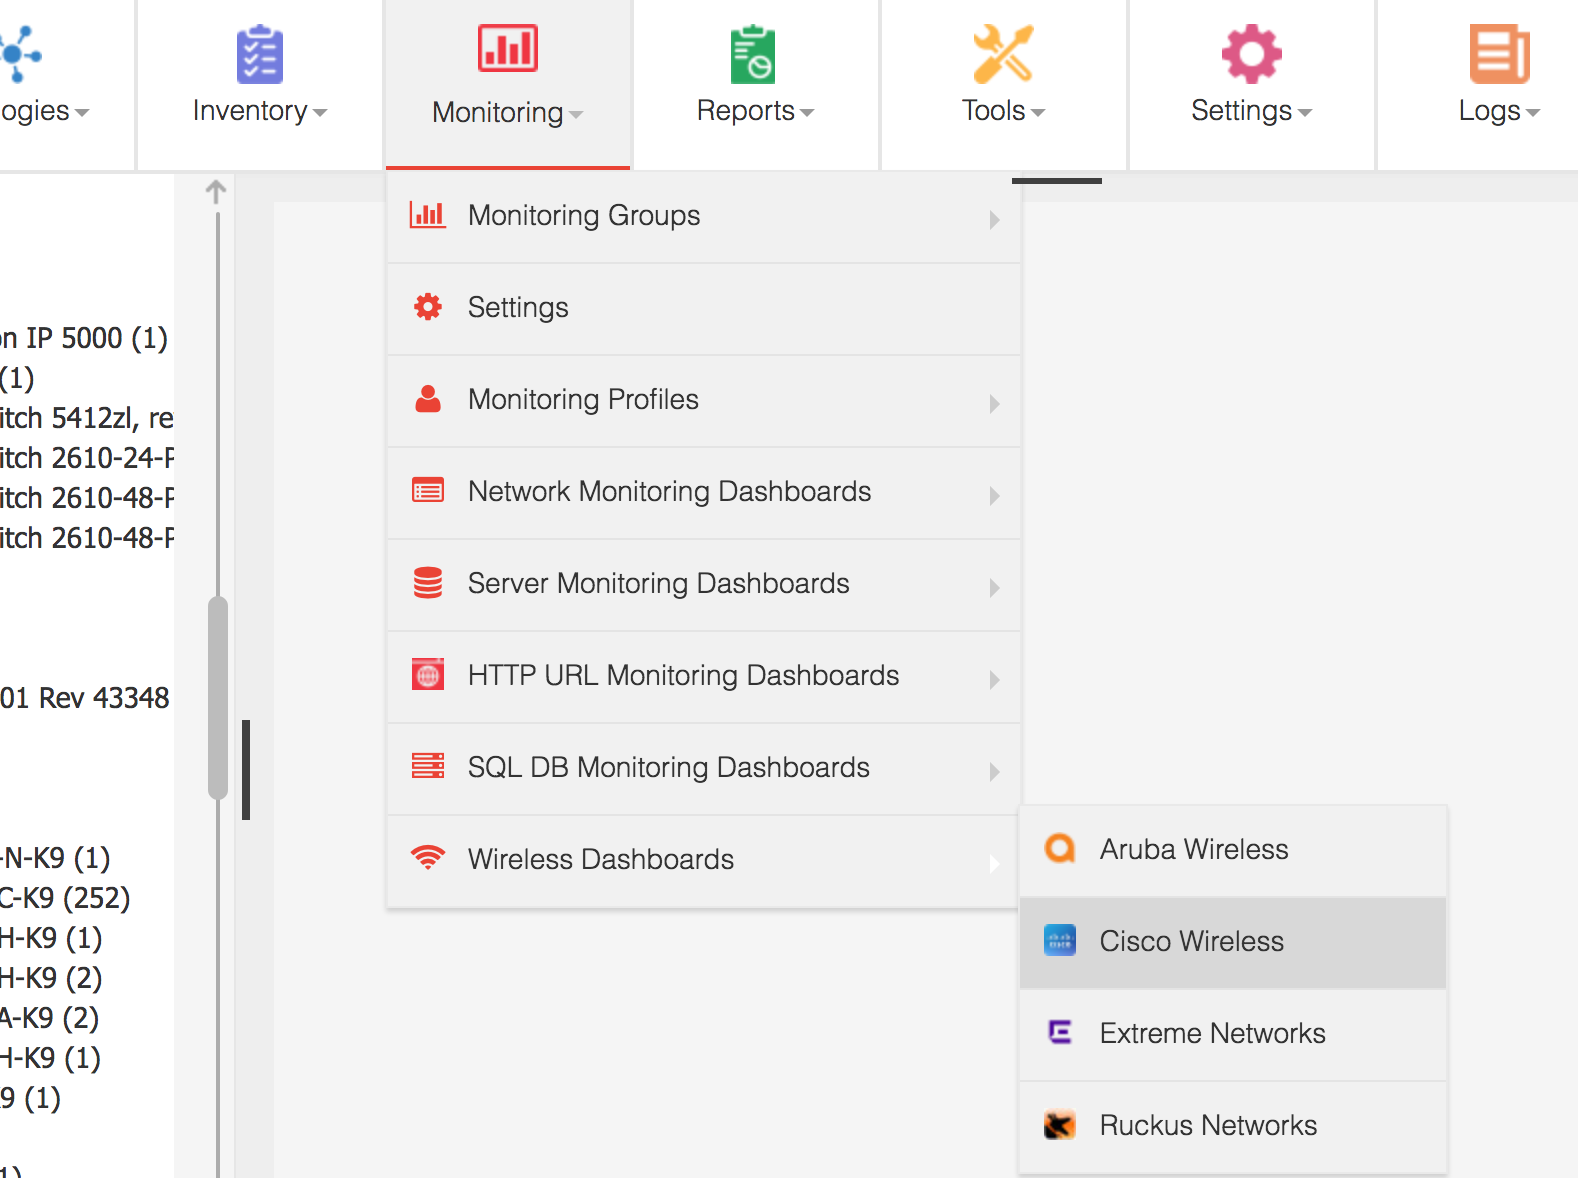
The wireless dashboards are vendor specific and this is where you can find the dashboard for Cisco wireless devices:

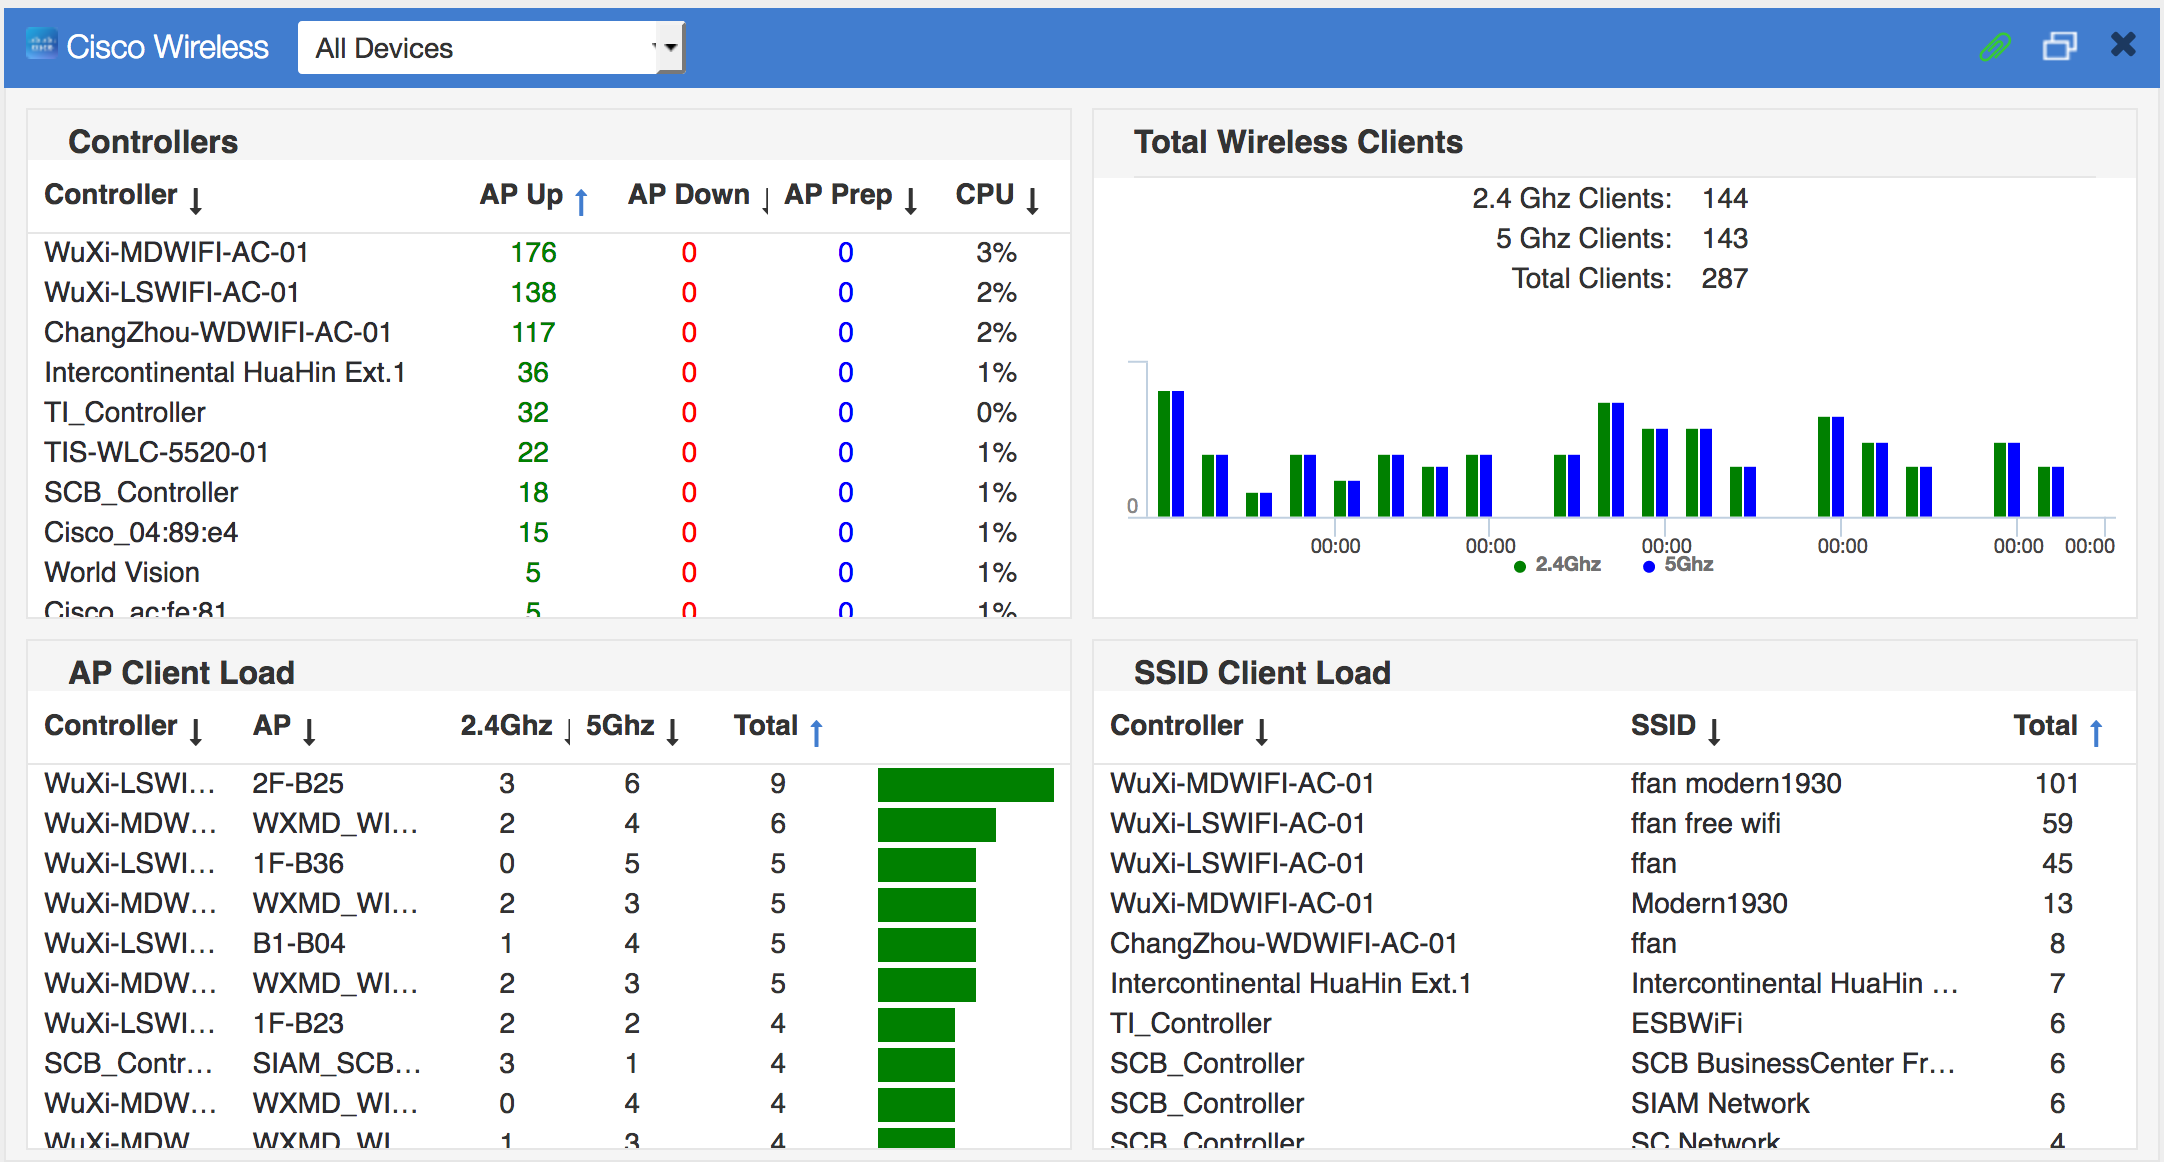
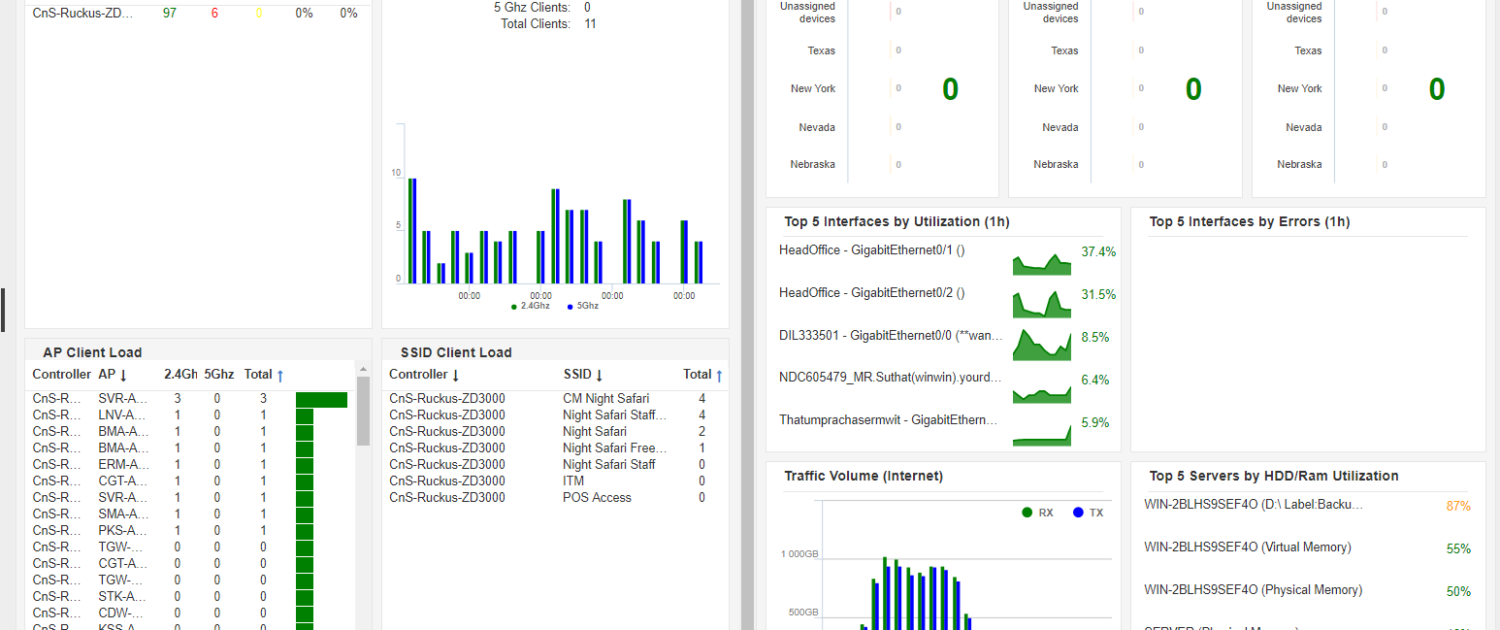
The focus of this article is on Cisco wireless devices, this is how the Cisco wireless dashboard looks like:

Wireless dashboard has multiple sections.
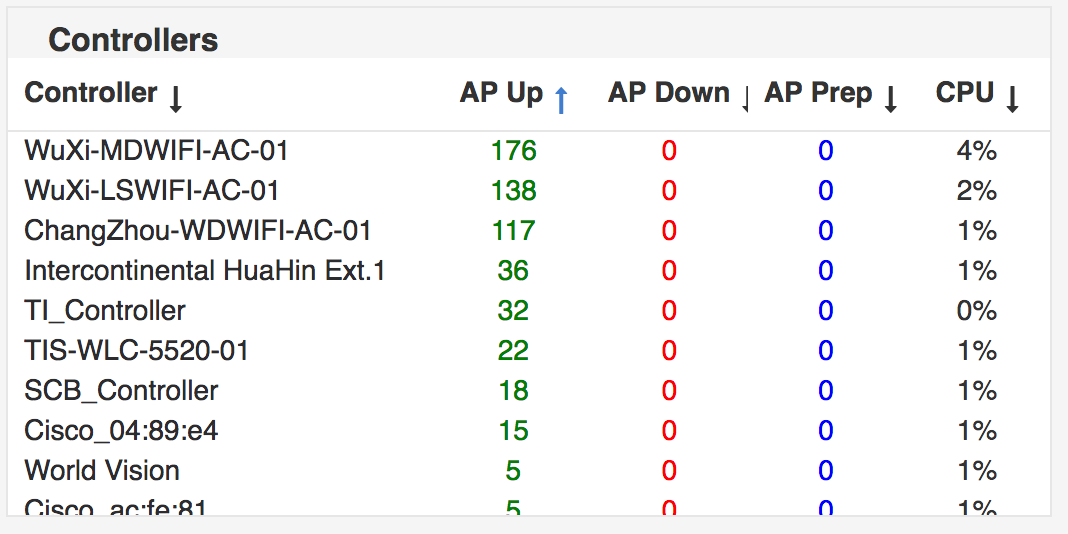
One of the sections covers the controllers and can provide information about the CPU usage, how many APs are Up, Down or Downloading:

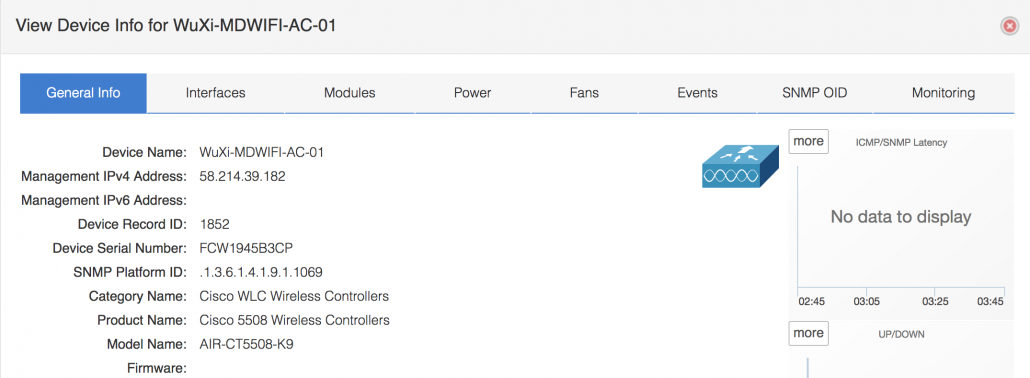
As always, you can get device details by selecting the controller:

The interesting things starts when you select the counters related to the number of APs that are up, down or in process of being associated with the controller.
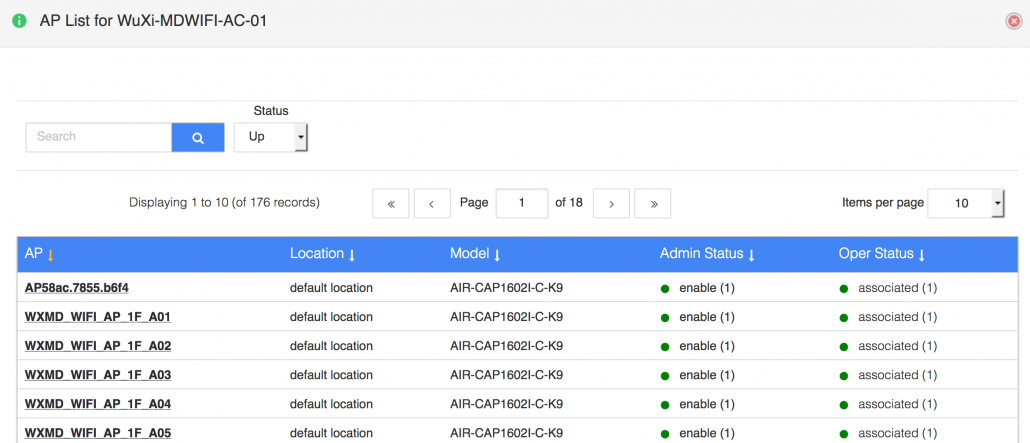
You get a list of APs in that state associated with that specific controller:

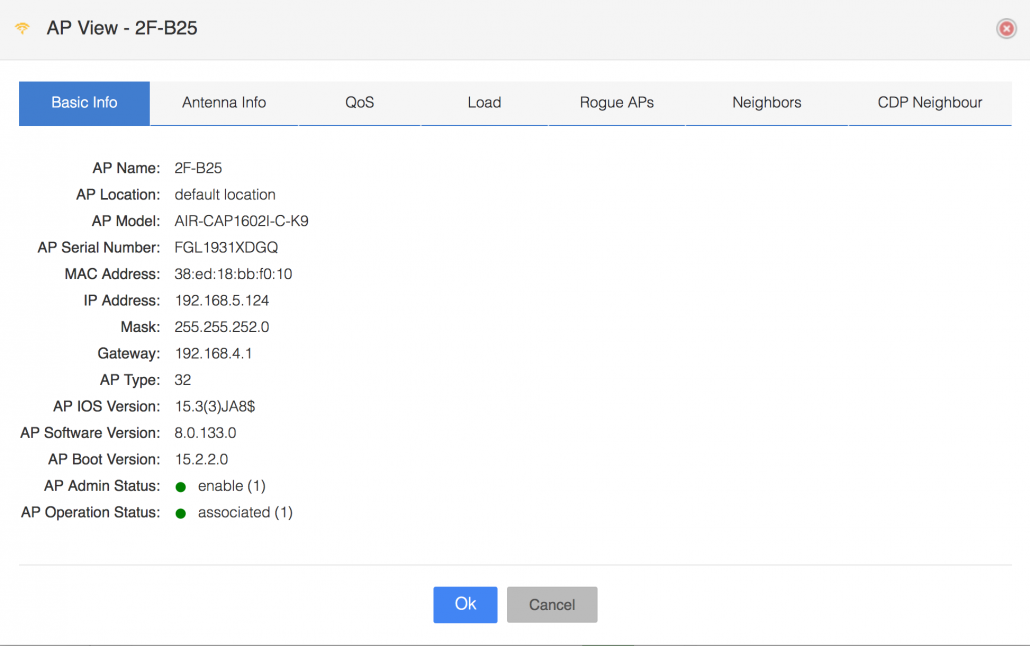
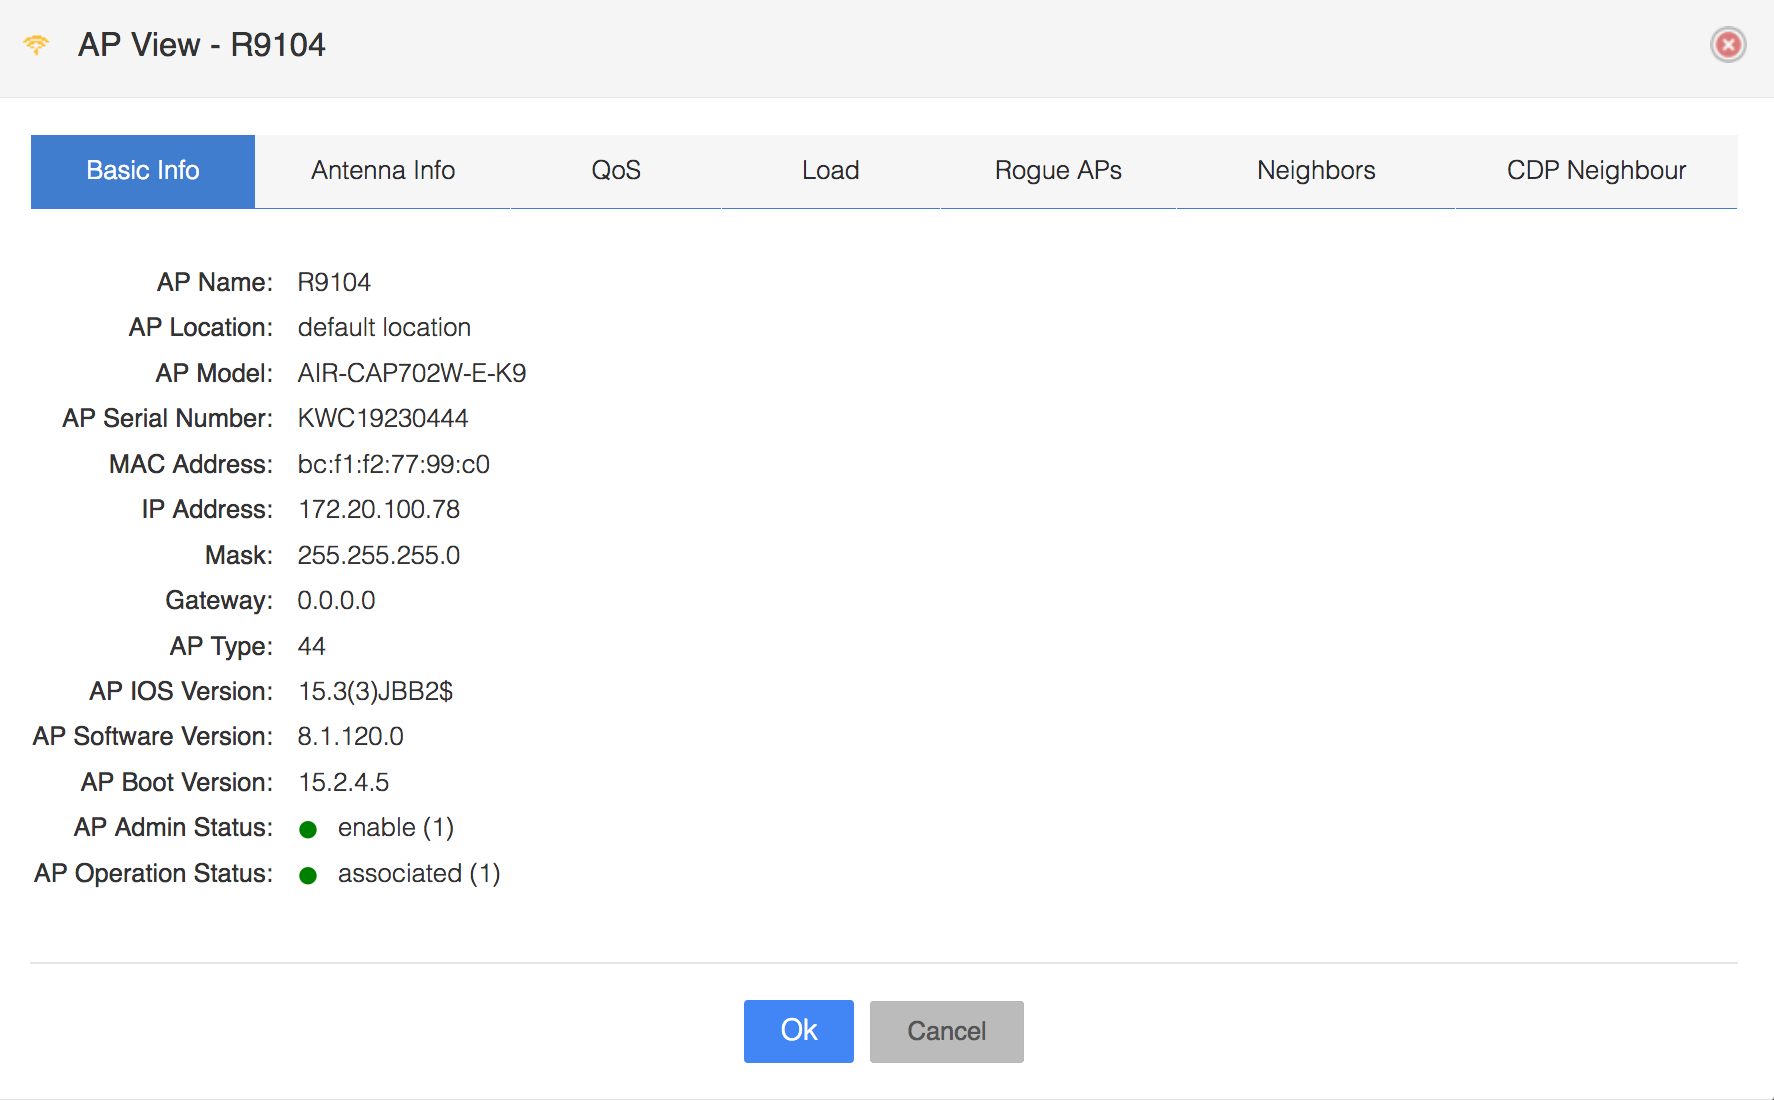
To get details about an AP, it is enough to select one of the APs and a window with multiple tabs will provide various information that can help the operator to understand how that specific AP operates.
The first tab provides the name of AP assigned by the operator, the model of AP, the operating system, the IP address and some other useful information about the AP.

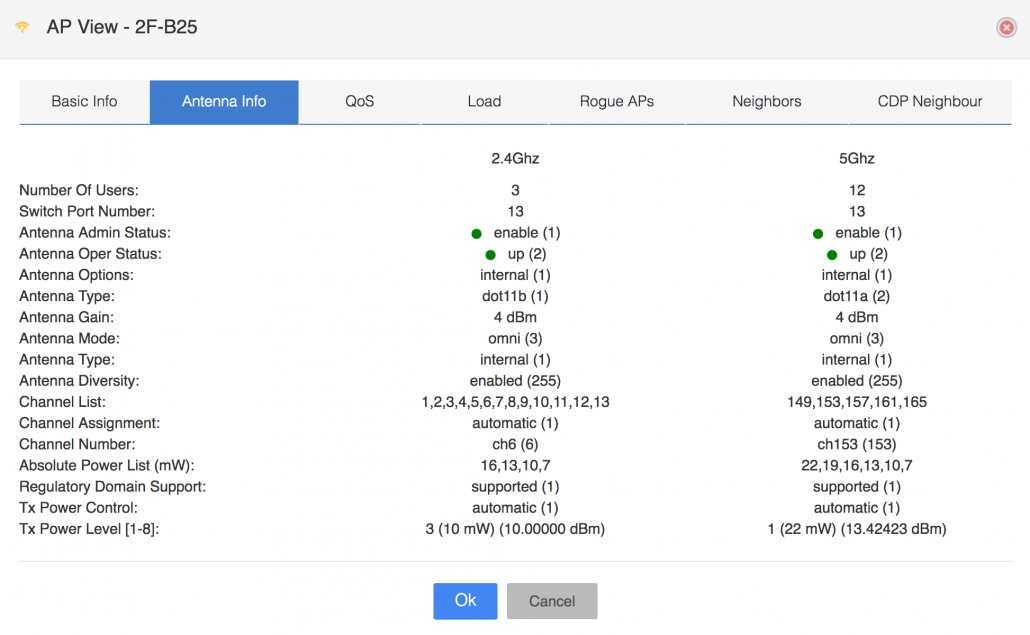
The next tab provides technical information about the two frequencies in which the AP operates:

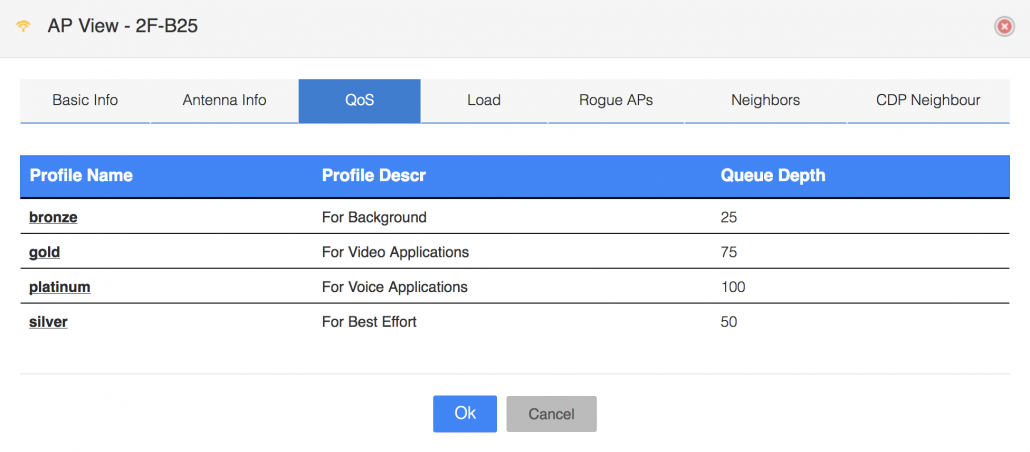
In the next tab, quality of service settings are covered:

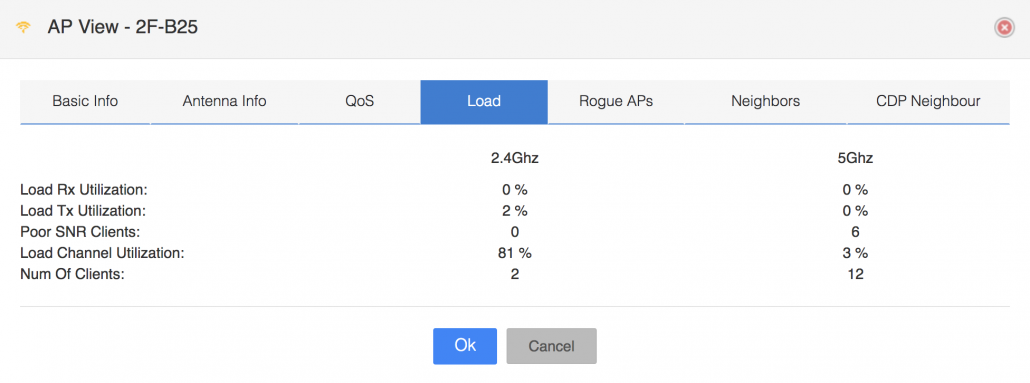
The forth tab is about the load in terms of number of clients, receive and transmit utilization for the frequencies supported:

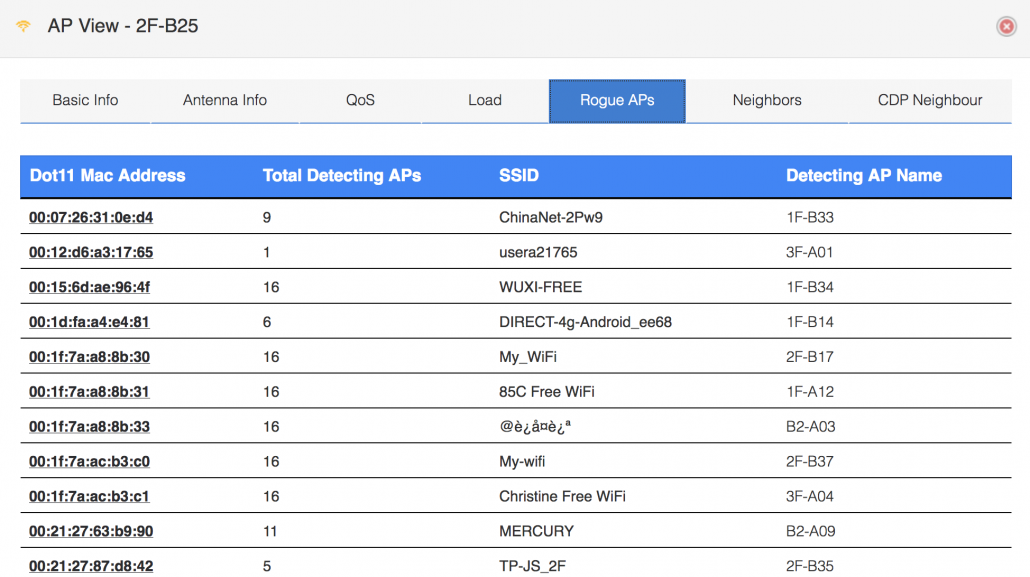
The next tab shows the rogue APs detected:

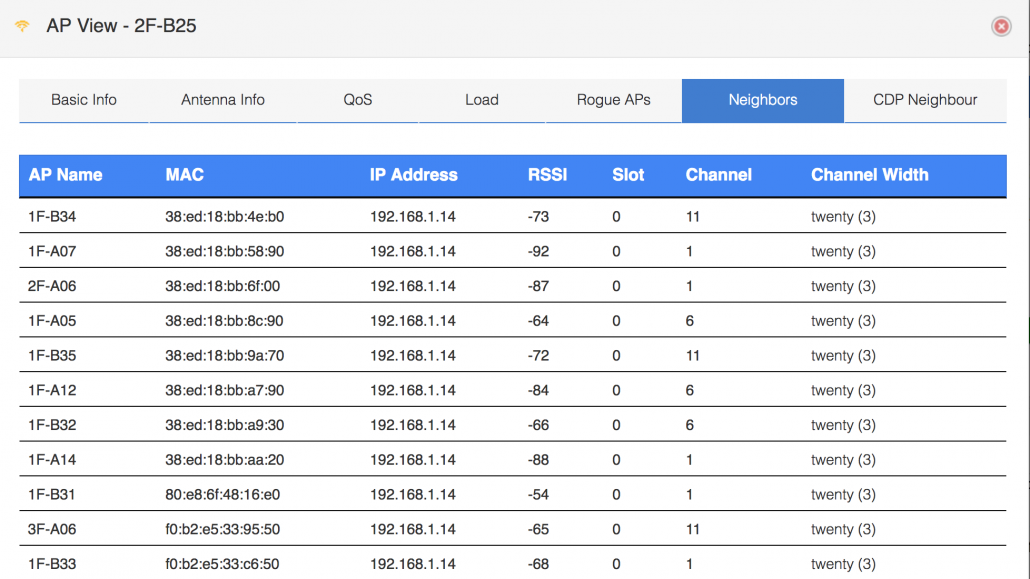
You can also see the neighbor APs and some of their characteristics:

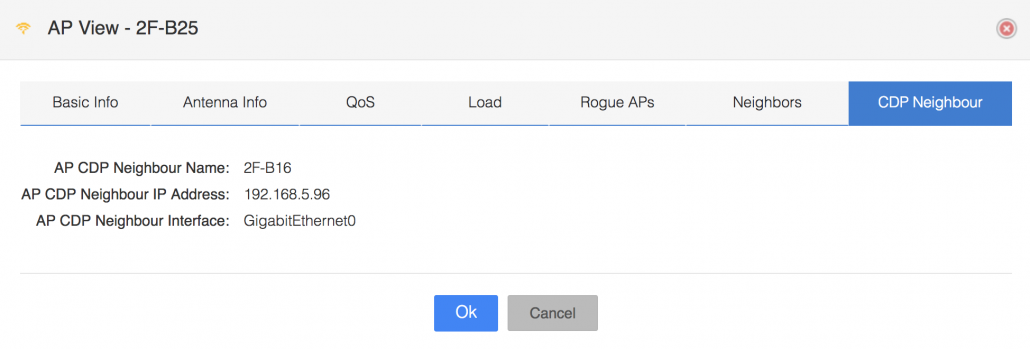
And the last tab shows the CDP neighbor:

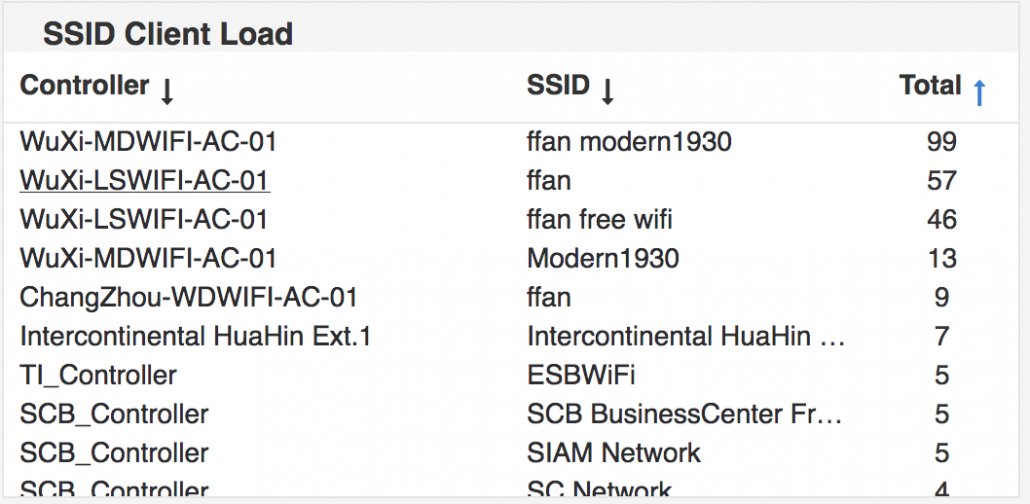
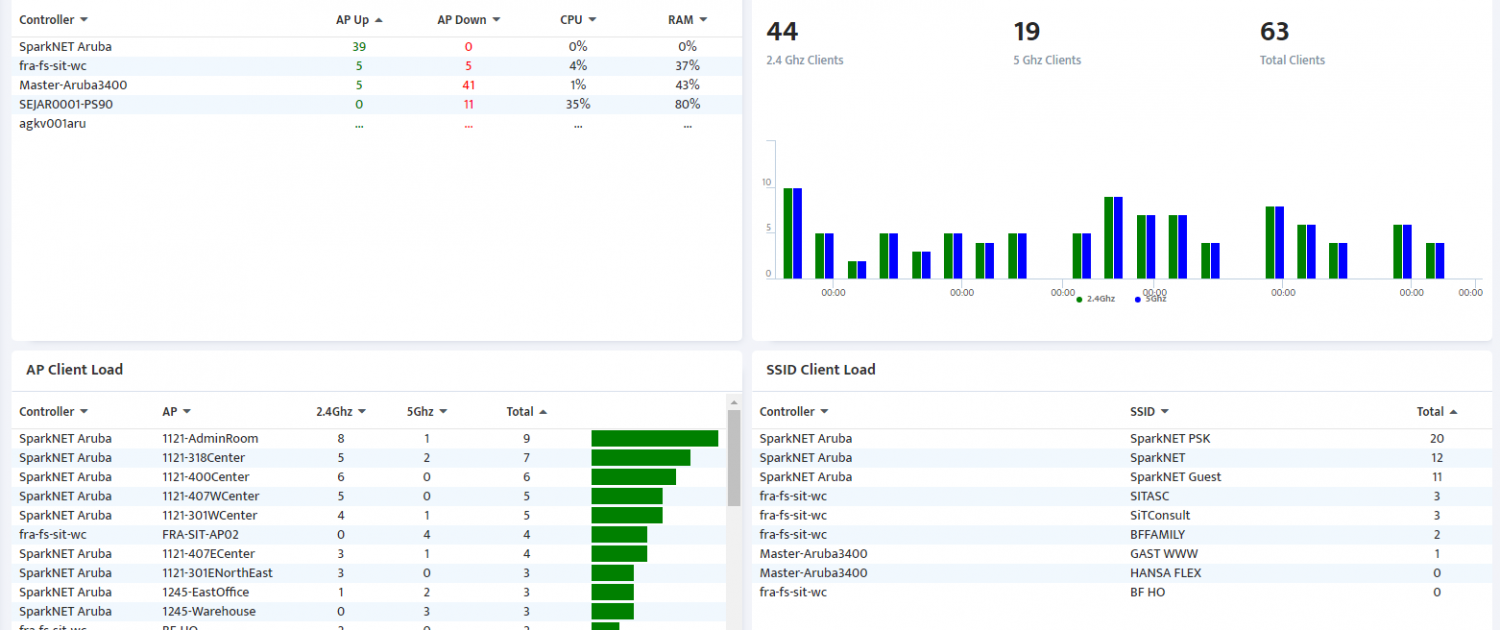
Another section of the wireless dashboard is the SSID Client load which shows how many clients are on each SSID:

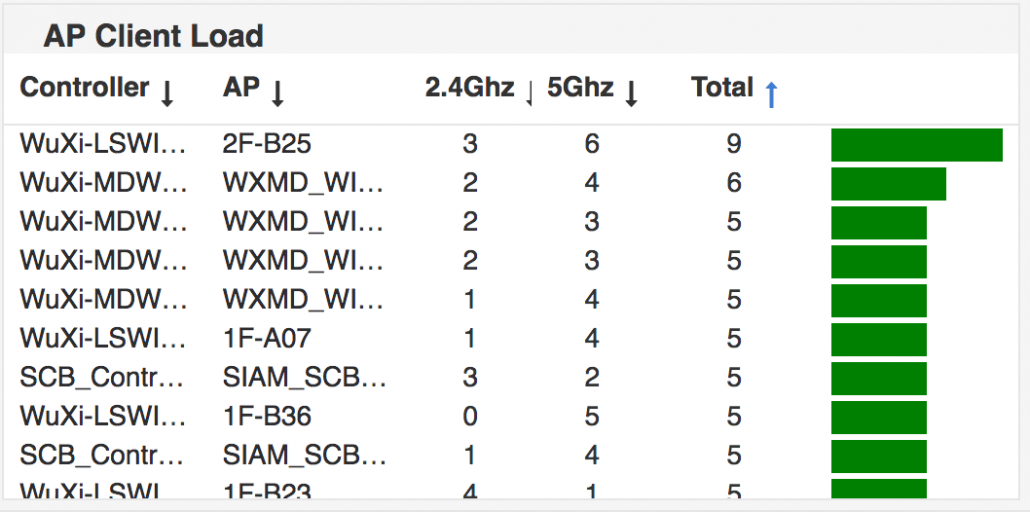
The wireless dashboard allows to see how many clients and on which frequency each AP has:

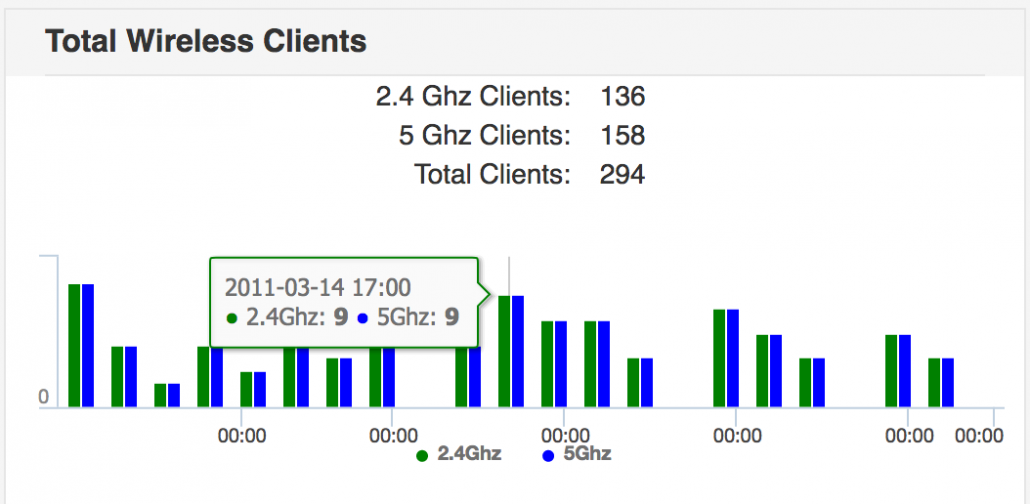
And the last section of the wireless dashboard is the one showing how many clients are on the two frequencies, 2.4Ghz and 5Ghz, in total and you can see some history of how many clients were at some point in time.

Nectus Cisco Wireless dashboard can provide useful information about the wireless devices, controllers and access points.

In this post we will cover some new functionality added to Nectus in latest Wireless release.

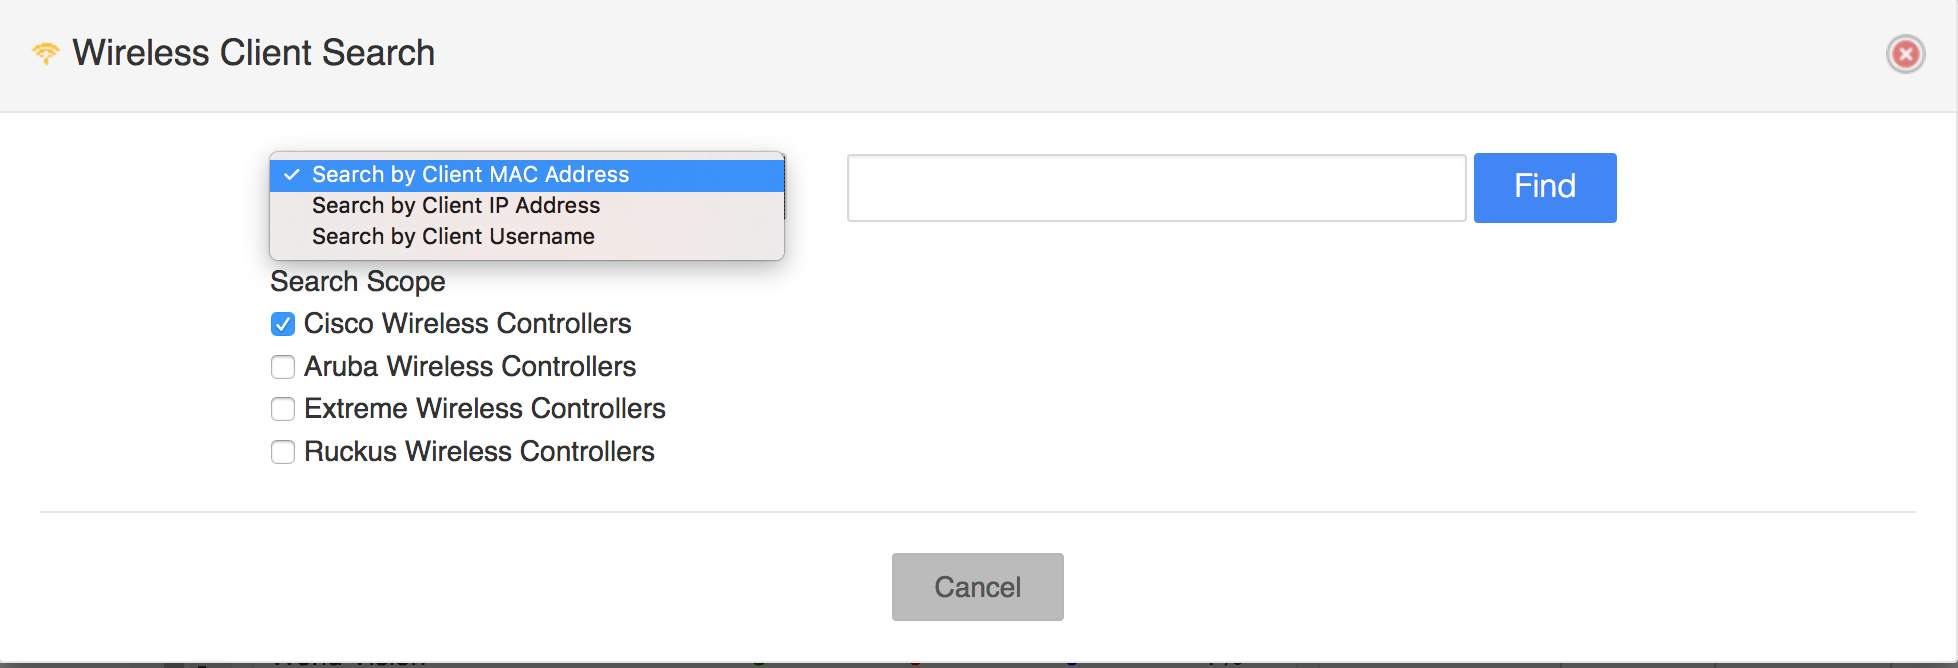
The “Wireless Client Search” allows the operator to find any wireless client by its MAC, IP address or Username.

The client search is located under main menu “Tools”:

In the menu, you have an option to search for a client based on the MAC, IP or Username. You can also restrict the scope where the search will take place:

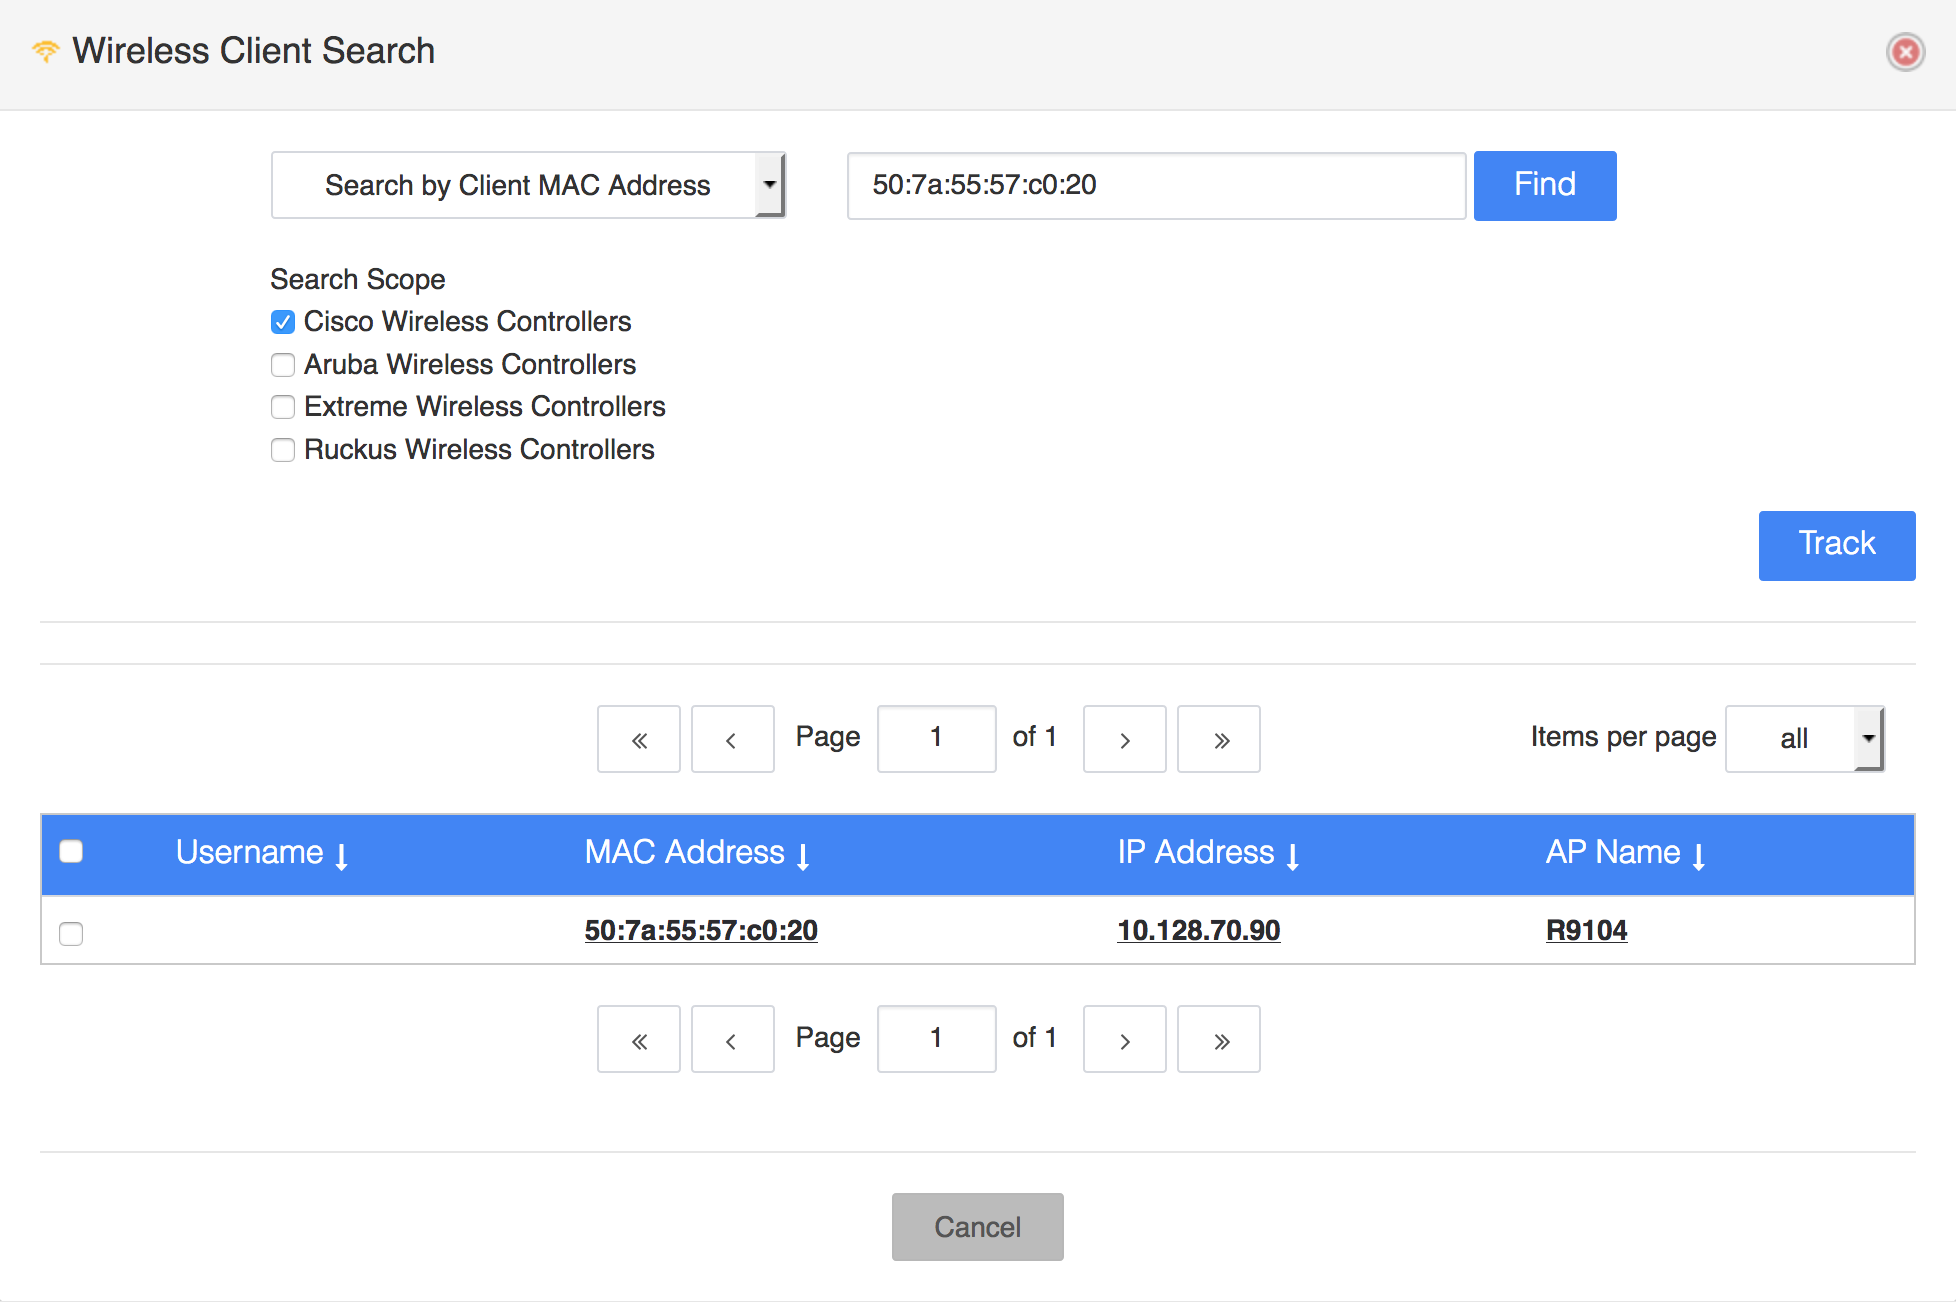
Here is how a result of a MAC search looks like. You can search using part of a MAC address as well, but you need to provide at least 3 characters (two numbers and “:” )

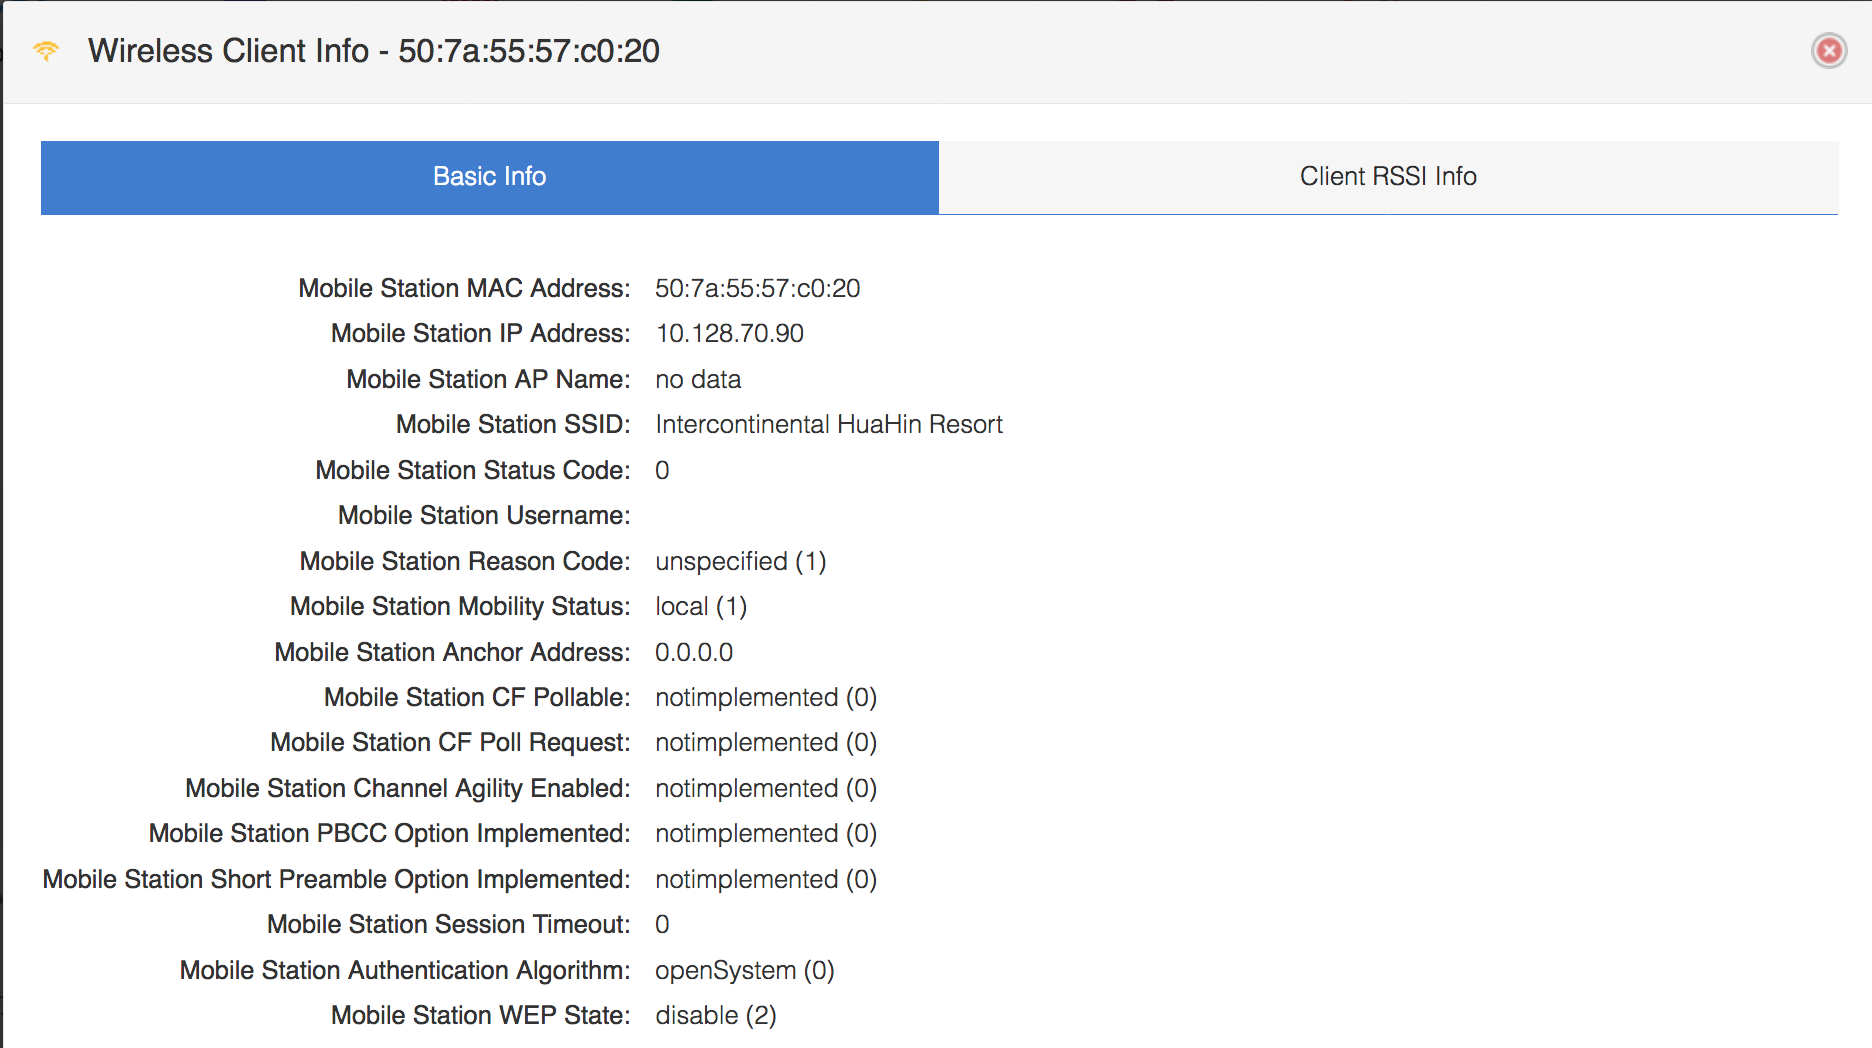
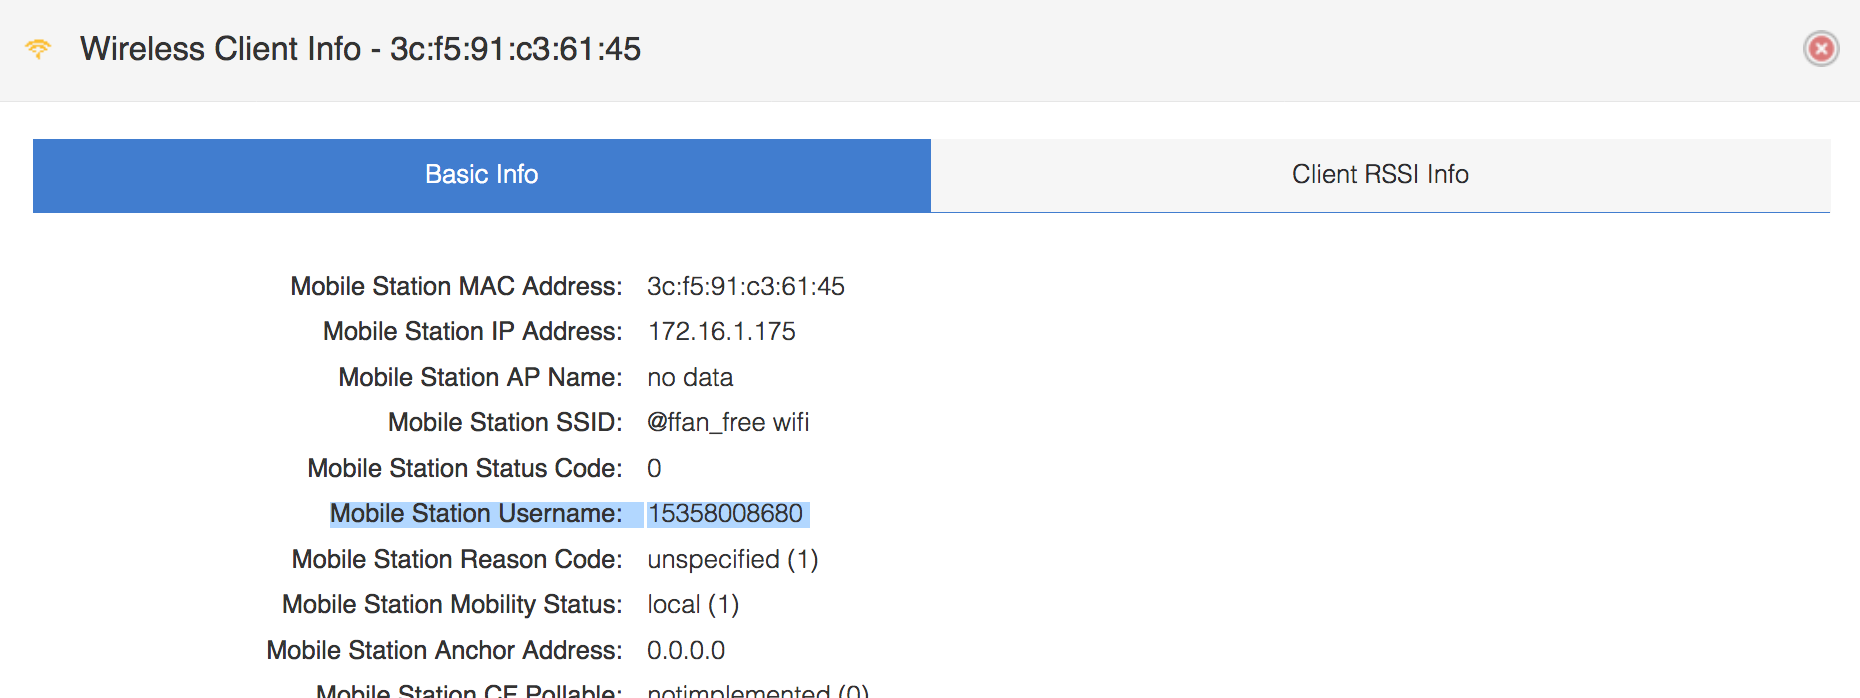
You can view the client details by clicking either on MAC address or IP address and the new window will show Client’s basic info like like SSID, RSSI etc.:

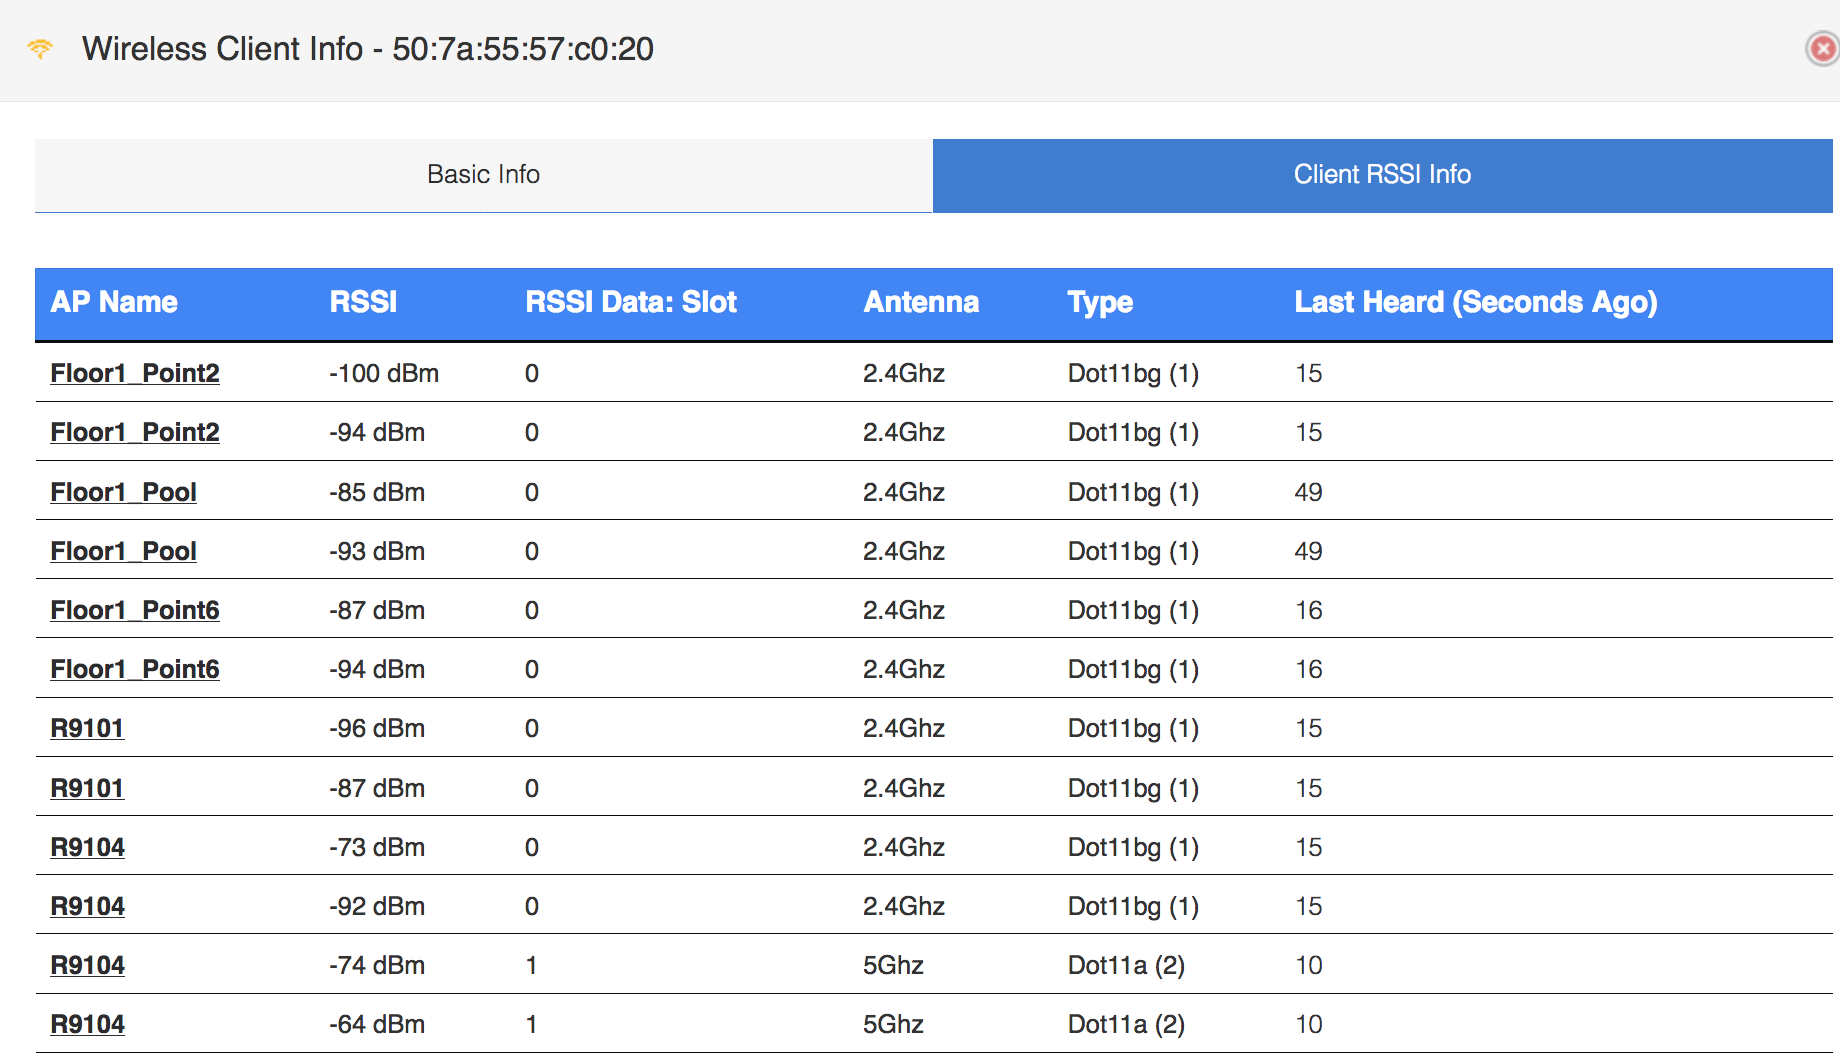
The second tab will show the RSSI from various APs that detects client’s signal:

If AP name is clicked, then you will get detailed information about the AP:

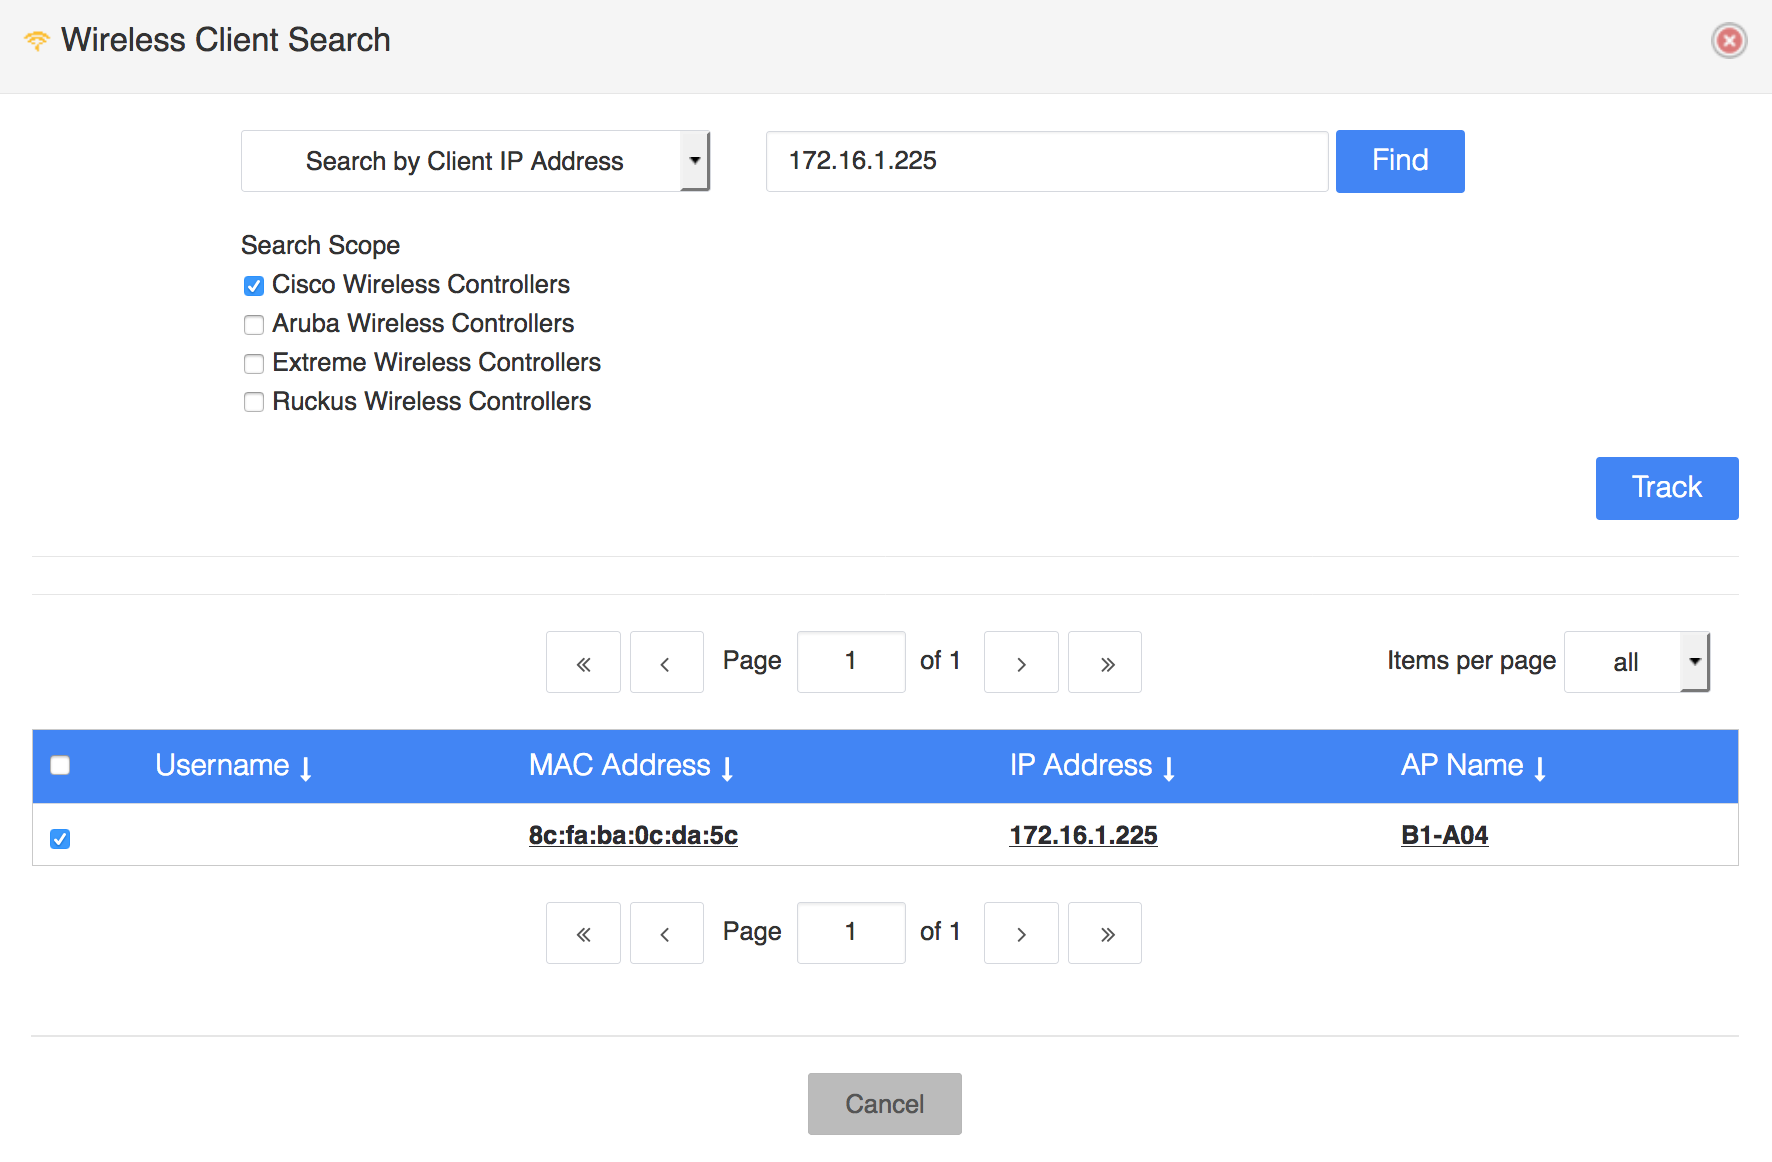
Next, you can search for an IP address (again, you do not have to specify full IP address):

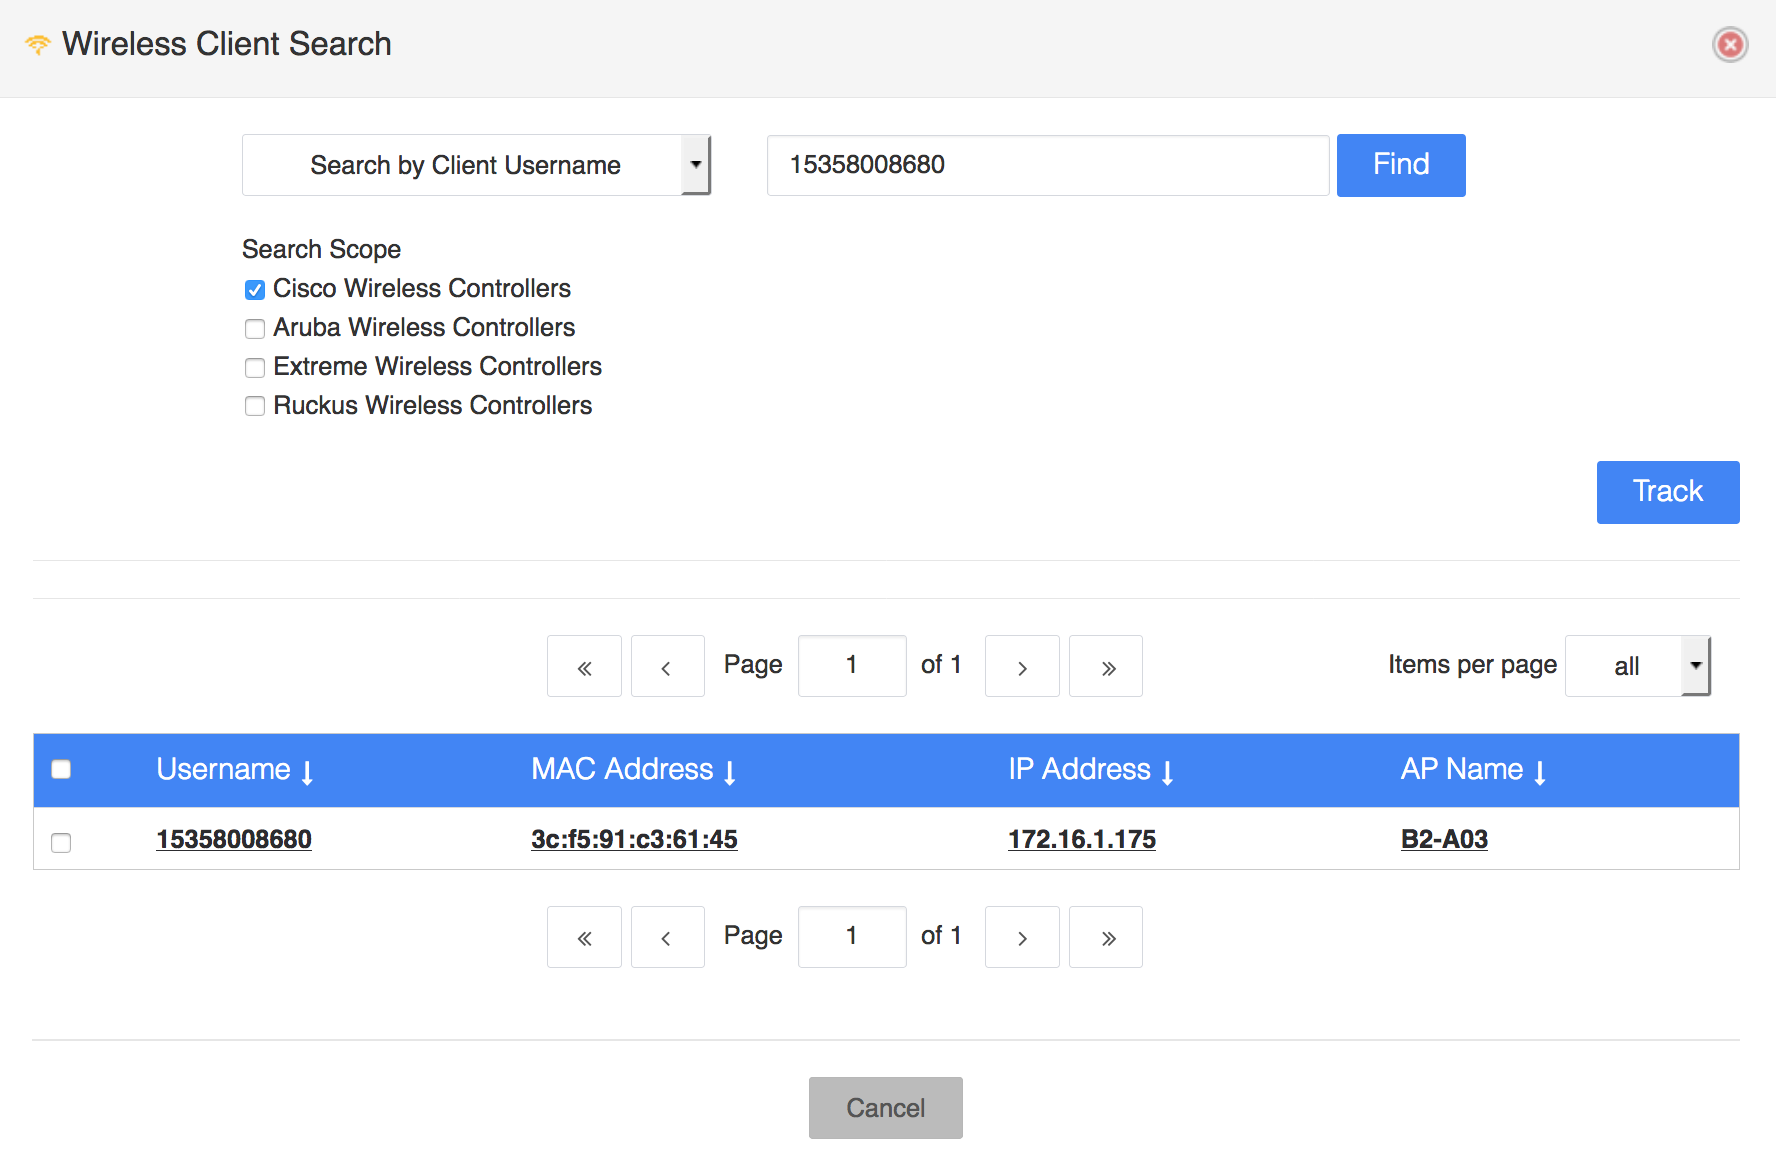
The last option is to search using an username:

The username is shown in the client detailed information:

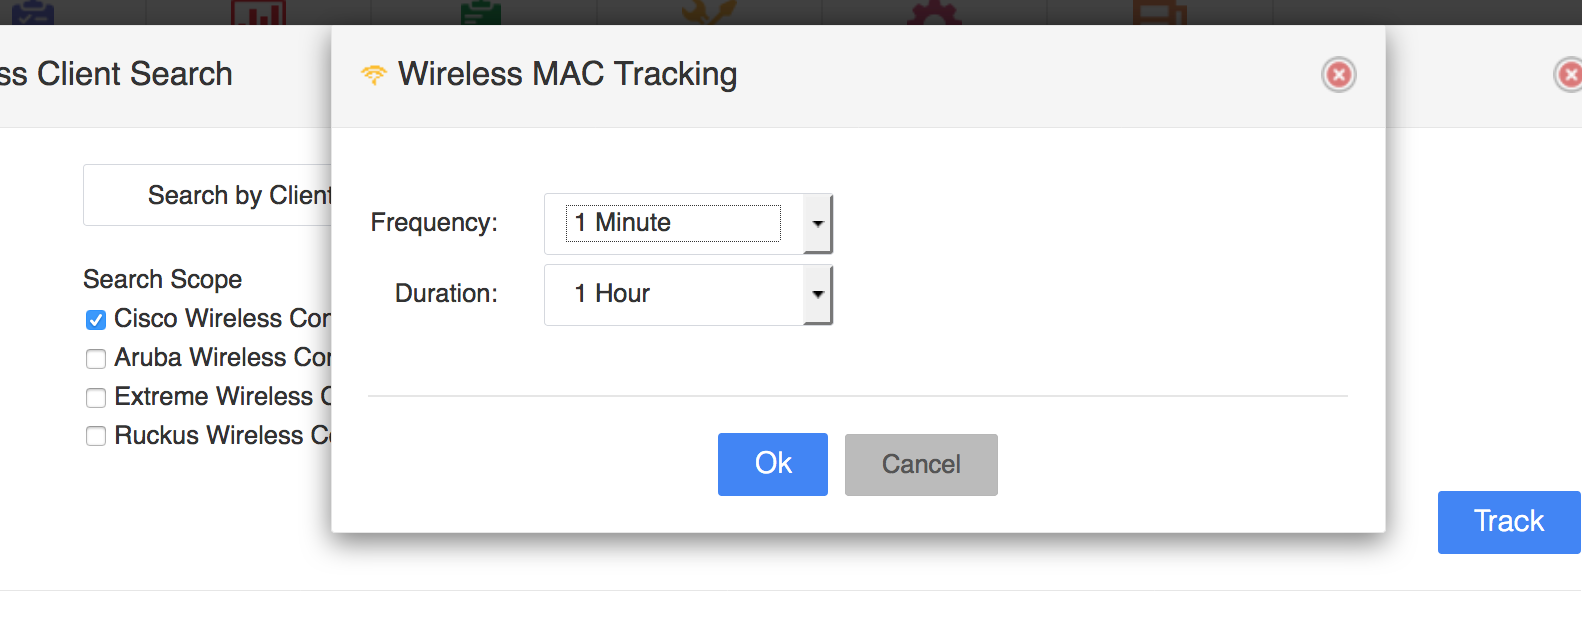
Coming back to the search window, there is the possibility to track a client. You actually track the MAC address of the client to see if and where the client roamed across the wireless network. One or more clients can be tracked in the same time:

You need to specify how often Nectus should check this MAC address and for how long. If you know the client goes on and off often or it moves around the wireless network, then you might want to use an aggressive timer for frequency to get accurate data about availability:

The list of the tracked clients can be seen here:

And the list is this:

A client can be added for tracking from this menu as well:

And here is how the tracking information looks like for a client:

This shows that the client did not move to another AP, so there was no or little movement of the client.


In this post, we will cover the wireless heat maps and how they are created in Nectus.

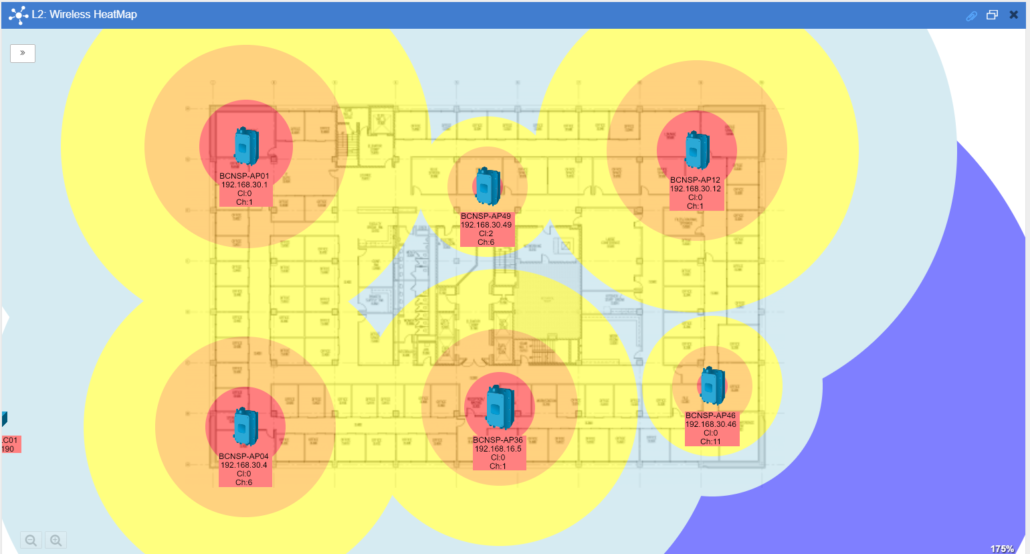
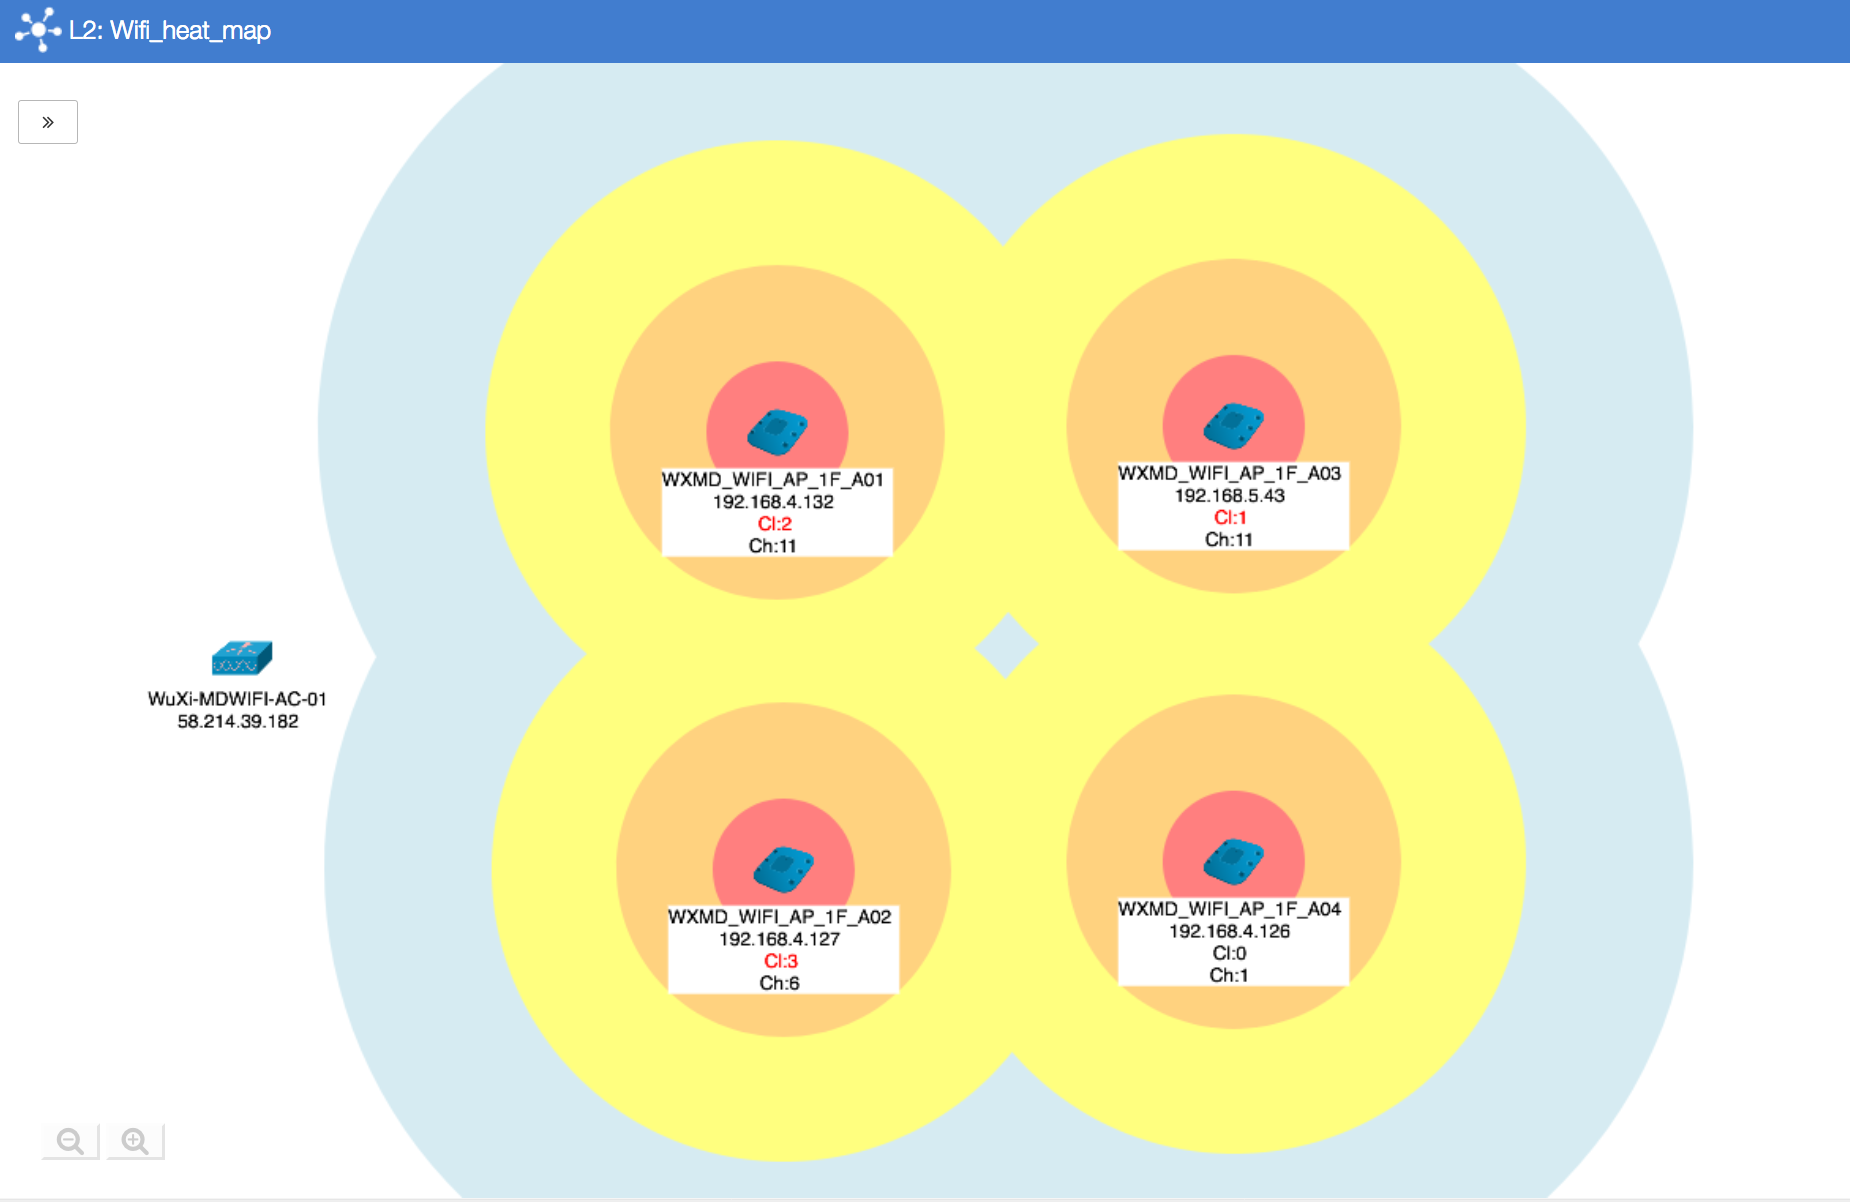
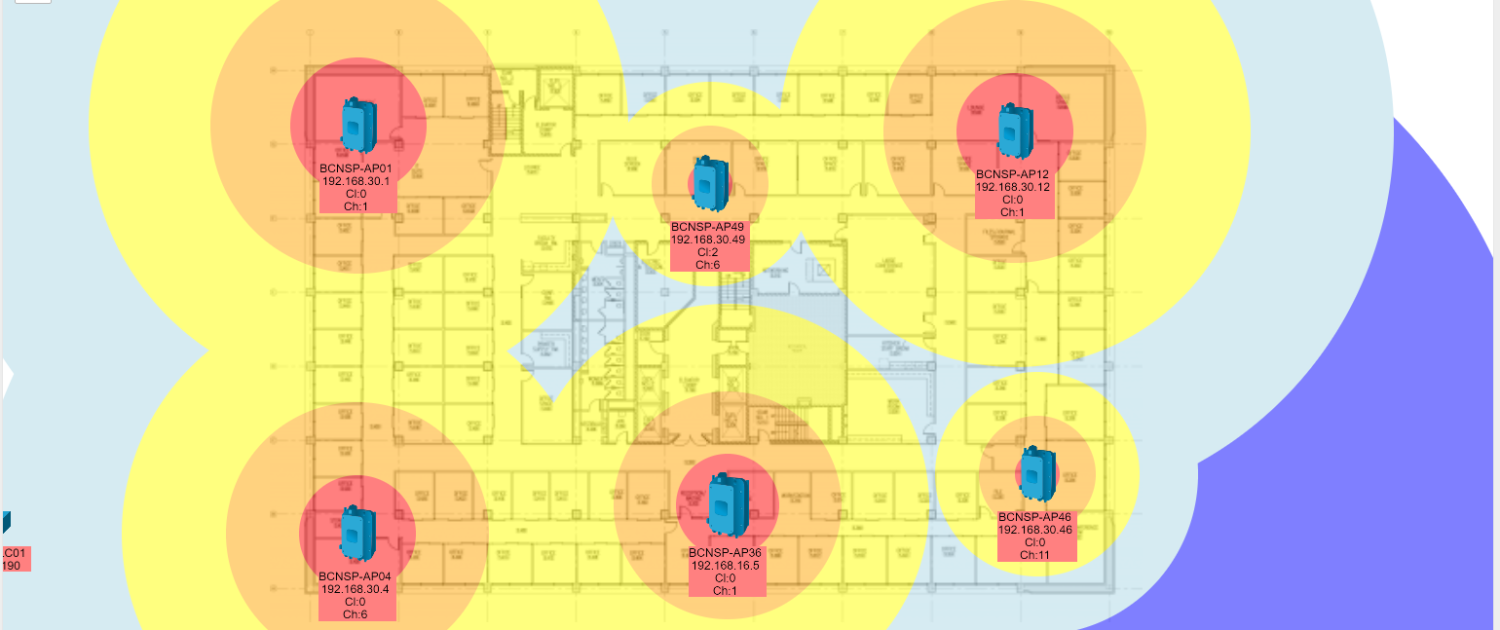
A heat map will allow to visualize the state of the wireless coverage and help to take decision in order to improve the coverage.

Using the information from APs along with a map of physical location, you can find out where are the hot and cold spots.

A heat map is a L2 topology diagram where you can add access points and optionally the controller to which the access points are associated with.

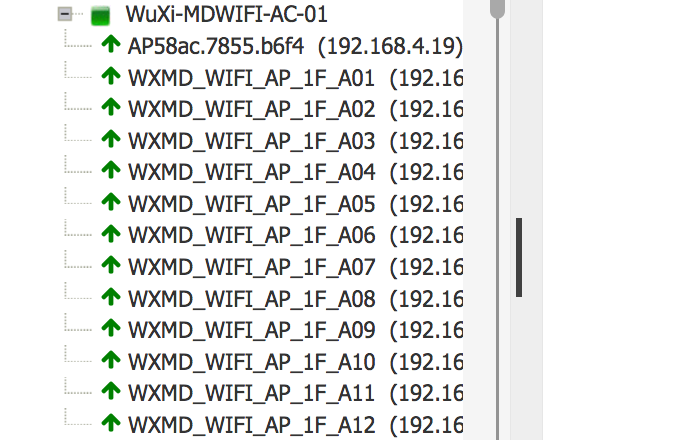
You can add the controller and the APs from the list of controllers:

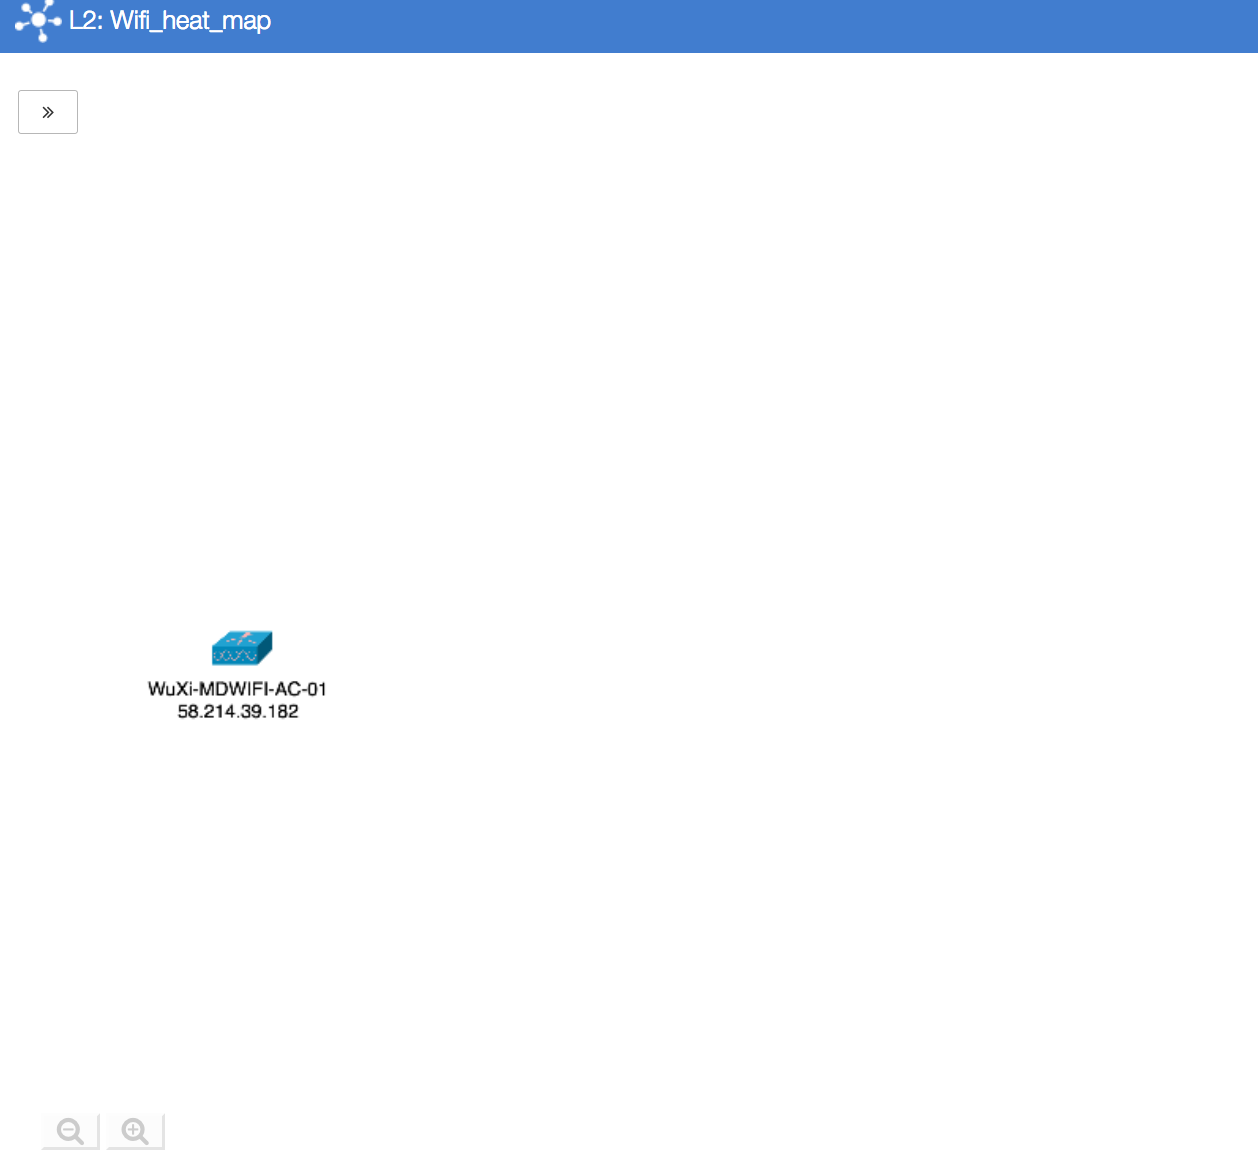
If the controller and several APs are added to the topology, it will look like this:

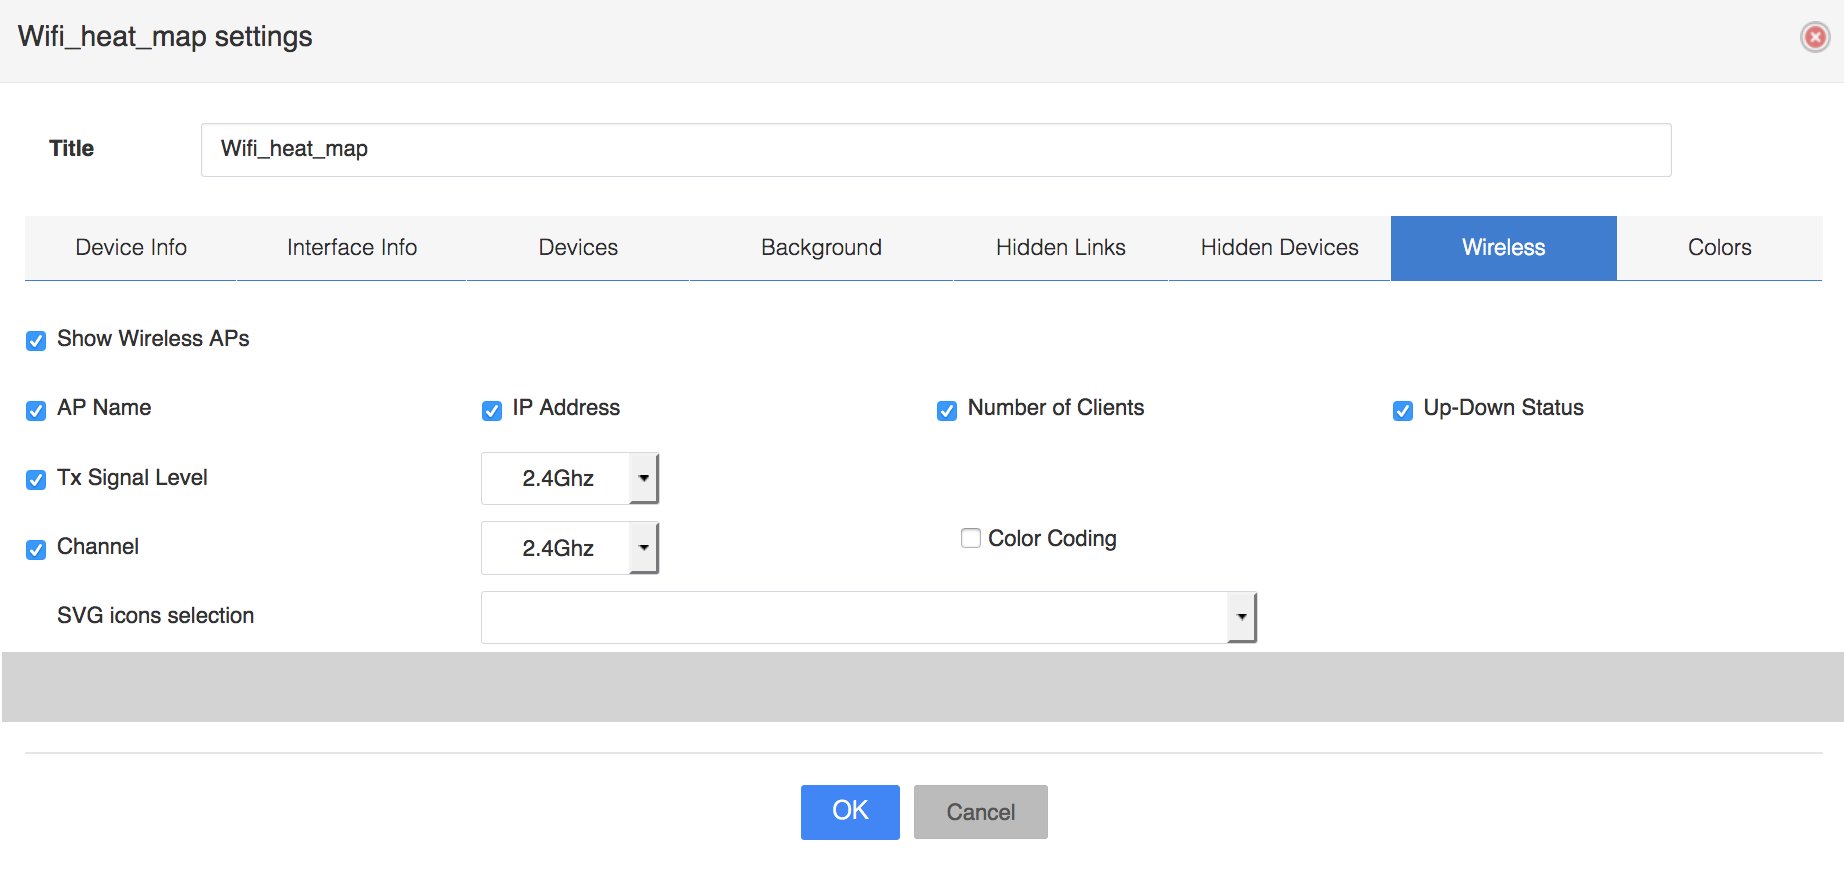
In the topology toolbar settings option, you must check the option to see access points in the topology:

Afterwards, the topology looks like this:

You can see which channel is used on each AP and how many clients are connected to each AP.

Ruckus “Antenna Info” SNMP OIDs
===========================

Antenna Type (0 = 802.11bg, 1 = 802.11a, 2 = 802.11ng, 3 = 802.11na, 4 = 802.11ac)

‘1.3.6.1.4.1.25053.1.2.2.1.1.2.2.1.3.[6.108.170.179.26.66.144].[0]’ => “2”
‘1.3.6.1.4.1.25053.1.2.2.1.1.2.2.1.3.[6.108.170.179.26.66.144].[1]’ => “3”

Antenna Gain (dB)
‘1.3.6.1.4.1.25053.1.2.2.1.1.2.2.1.44.[6.108.170.179.26.66.144].[0]’ => “7”
‘1.3.6.1.4.1.25053.1.2.2.1.1.2.2.1.44.[6.108.170.179.26.66.144].[1]’ => “7”

Tx Power Level (0 = Full, 1 = Half, 2 = Quarter, 3 = Eighth)
‘1.3.6.1.4.1.25053.1.2.2.1.1.2.2.1.5.[6.108.170.179.26.66.144].[0]’ => “0”
‘1.3.6.1.4.1.25053.1.2.2.1.1.2.2.1.5.[6.108.170.179.26.66.144].[1]’ => “0”

Channel Number
‘1.3.6.1.4.1.25053.1.2.2.1.1.2.2.1.4.[6.108.170.179.26.66.144].[0]’ => “1”
‘1.3.6.1.4.1.25053.1.2.2.1.1.2.2.1.4.[6.108.170.179.26.66.144].[1]’ => “36”

Number Of Current Users
‘1.3.6.1.4.1.25053.1.2.2.1.1.2.2.1.8.[6.108.170.179.26.66.144].[0]’ => “0”
‘1.3.6.1.4.1.25053.1.2.2.1.1.2.2.1.8.[6.108.170.179.26.66.144].[1]’ => “0”

Utilization (%)
‘1.3.6.1.4.1.25053.1.2.2.1.1.2.2.1.40.[6.108.170.179.26.66.144].[0]’ => “0”
‘1.3.6.1.4.1.25053.1.2.2.1.1.2.2.1.40.[6.108.170.179.26.66.144].[1]’ => “0”

Average Client RSSI (dBm)
‘1.3.6.1.4.1.25053.1.2.2.1.1.2.2.1.9.[6.108.170.179.26.66.144].[0]’ => “0”
‘1.3.6.1.4.1.25053.1.2.2.1.1.2.2.1.9.[6.108.170.179.26.66.144].[1]’ => “0”

Antenna MAC Address
‘1.3.6.1.4.1.25053.1.2.2.1.1.2.2.1.1.[6.108.170.179.26.66.144].[0]’ => “lª³B”
‘1.3.6.1.4.1.25053.1.2.2.1.1.2.2.1.1.[6.108.170.179.26.66.144].[1]’ => “lª³B”

Antenna Mesh Enabled (1 – Yes, 2 = No)
‘1.3.6.1.4.1.25053.1.2.2.1.1.2.2.1.6.[6.108.170.179.26.66.144].[0]’ => “2”
‘1.3.6.1.4.1.25053.1.2.2.1.1.2.2.1.6.[6.108.170.179.26.66.144].[1]’ => “2”

Power Management Enabled (1 = Yes, 0 = No)
‘1.3.6.1.4.1.25053.1.2.2.1.1.2.2.1.18.[6.108.170.179.26.66.144].[0]’ => “1”
‘1.3.6.1.4.1.25053.1.2.2.1.1.2.2.1.18.[6.108.170.179.26.66.144].[1]’ => “1”

Max. Number of Clients Allowed
‘1.3.6.1.4.1.25053.1.2.2.1.1.2.2.1.19.[6.108.170.179.26.66.144].[0]’ => “256”
‘1.3.6.1.4.1.25053.1.2.2.1.1.2.2.1.19.[6.108.170.179.26.66.144].[1]’ => “256”

Antenna Rx Packets
‘1.3.6.1.4.1.25053.1.2.2.1.1.2.2.1.10.[6.108.170.179.26.66.144].[0]’ => “1047794”
‘1.3.6.1.4.1.25053.1.2.2.1.1.2.2.1.10.[6.108.170.179.26.66.144].[1]’ => “5447”

Antenna Rx Bytes
‘1.3.6.1.4.1.25053.1.2.2.1.1.2.2.1.11.[6.108.170.179.26.66.144].[0]’ => “223745214”
‘1.3.6.1.4.1.25053.1.2.2.1.1.2.2.1.11.[6.108.170.179.26.66.144].[1]’ => “1050697”

Antenna Tx Packets
‘1.3.6.1.4.1.25053.1.2.2.1.1.2.2.1.13.[6.108.170.179.26.66.144].[0]’ => “42252”
‘1.3.6.1.4.1.25053.1.2.2.1.1.2.2.1.13.[6.108.170.179.26.66.144].[1]’ => “6080”

Antenna Tx Bytes
‘1.3.6.1.4.1.25053.1.2.2.1.1.2.2.1.14.[6.108.170.179.26.66.144].[0]’ => “8941040”
‘1.3.6.1.4.1.25053.1.2.2.1.1.2.2.1.14.[6.108.170.179.26.66.144].[1]’ => “921628”

Number of Tx Fails
‘1.3.6.1.4.1.25053.1.2.2.1.1.2.2.1.16.[6.108.170.179.26.66.144].[0]’ => “0”
‘1.3.6.1.4.1.25053.1.2.2.1.1.2.2.1.16.[6.108.170.179.26.66.144].[1]’ => “0”

Number of Tx Retries
‘1.3.6.1.4.1.25053.1.2.2.1.1.2.2.1.17.[6.108.170.179.26.66.144].[0]’ => “2875”
‘1.3.6.1.4.1.25053.1.2.2.1.1.2.2.1.17.[6.108.170.179.26.66.144].[1]’ => “8”

Authentication Requests
‘1.3.6.1.4.1.25053.1.2.2.1.1.2.2.1.25.[6.108.170.179.26.66.144].[0]’ => “1”
‘1.3.6.1.4.1.25053.1.2.2.1.1.2.2.1.25.[6.108.170.179.26.66.144].[1]’ => “0”

Authentication Responses
‘1.3.6.1.4.1.25053.1.2.2.1.1.2.2.1.26.[6.108.170.179.26.66.144].[0]’ => “1”
‘1.3.6.1.4.1.25053.1.2.2.1.1.2.2.1.26.[6.108.170.179.26.66.144].[1]’ => “0”

Authentication Success
‘1.3.6.1.4.1.25053.1.2.2.1.1.2.2.1.27.[6.108.170.179.26.66.144].[0]’ => “1”
‘1.3.6.1.4.1.25053.1.2.2.1.1.2.2.1.27.[6.108.170.179.26.66.144].[1]’ => “0”

Authentication Failed
‘1.3.6.1.4.1.25053.1.2.2.1.1.2.2.1.28.[6.108.170.179.26.66.144].[0]’ => “0”
‘1.3.6.1.4.1.25053.1.2.2.1.1.2.2.1.28.[6.108.170.179.26.66.144].[1]’ => “0”

Support for  Ruckus Wireless Controllers was added to Nectus.

AP Name:    1.3.6.1.4.1.25053.1.2.2.1.1.2.1.1.2

AP Name:    1.3.6.1.4.1.25053.1.2.2.1.1.2.1.1.2

AP Model:    1.3.6.1.4.1.25053.1.2.2.1.1.2.1.1.4

Operation Status: 1.3.6.1.4.1.25053.1.2.2.1.1.2.1.1.3   (0 = Down, 1 = Up,  2,3,4 = Prep)

Connected Clients:      1.3.6.1.4.1.25053.1.2.2.1.1.2.1.1.15

Coverage: 1.3.6.1.4.1.25053.1.2.2.1.1.2.1.1.59  (1 = Indoor, 2 = Indoor-Distribute, 3 = Outdoor)

Connection mode:      1.3.6.1.4.1.25053.1.2.2.1.1.2.1.1.17  (0 = Layer2, 1 = Layer3)

Serial Number:    1.3.6.1.4.1.25053.1.2.2.1.1.2.1.1.5

Software Version:    1.3.6.1.4.1.25053.1.2.2.1.1.2.1.1.7

HW Version:          1.3.6.1.4.1.25053.1.2.2.1.1.2.1.1.8

Uptime:              1.3.6.1.4.1.25053.1.2.2.1.1.2.1.1.6

CPU Utilization:    1.3.6.1.4.1.25053.1.2.2.1.1.2.1.1.29

MAC Address:    1.3.6.1.4.1.25053.1.2.2.1.1.2.1.1.1

IP Address:    1.3.6.1.4.1.25053.1.2.2.1.1.2.1.1.10

Mask:    1.3.6.1.4.1.25053.1.2.2.1.1.2.1.1.100

Gateway:    1.3.6.1.4.1.25053.1.2.2.1.1.2.1.1.101

DNS Server 1:    1.3.6.1.4.1.25053.1.2.2.1.1.2.1.1.105

DNS Server 2:    1.3.6.1.4.1.25053.1.2.2.1.1.2.1.1.106

Max Number of Clients:    1.3.6.1.4.1.25053.1.2.2.1.1.2.1.1.110

Rogue Clients:    1.3.6.1.4.1.25053.1.2.2.1.1.2.1.1.16

Wireless Bytes Rx:    1.3.6.1.4.1.25053.1.2.2.1.1.2.1.1.61

Wireless Bytes Tx:    1.3.6.1.4.1.25053.1.2.2.1.1.2.1.1.62

LAN Bytes Rx:    1.3.6.1.4.1.25053.1.2.2.1.1.2.1.1.21

LAN Bytes Tx:    1.3.6.1.4.1.25053.1.2.2.1.1.2.1.1.25

LAN Drops:    1.3.6.1.4.1.25053.1.2.2.1.1.2.1.1.53

LAN Flaps:    1.3.6.1.4.1.25053.1.2.2.1.1.2.1.1.39

Nectus goes wireless. Starting from version 1.2.24  we added support for Cisco Wireless.

Powerful dashboards and RSSI heatmaps now available to all Nectus customers.    Download your copy of Nectus

One of the key features of Nectus is ability receive SNMP traps.  This allows the operator to quickly detect physical (links failures, flaps) or logical (adjacencies failures, flaps) changes in the network followed by restoration procedures or root cause analysis.
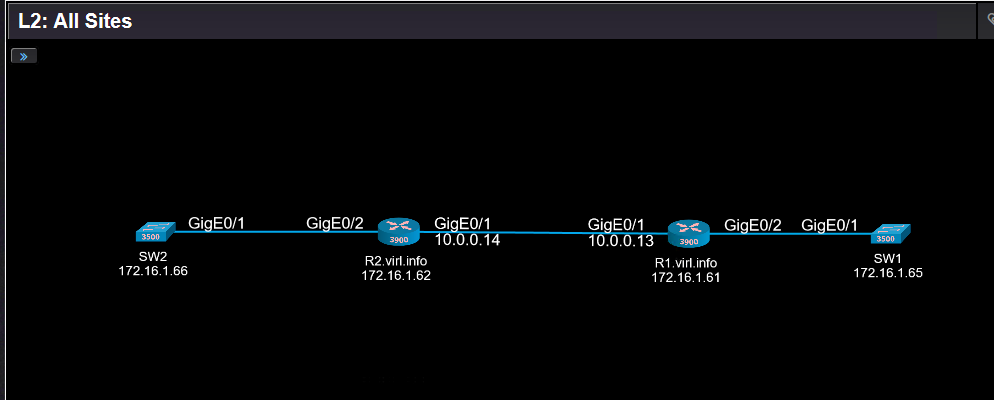
Let’s see how does it work on example of this Layer 2 diagram:

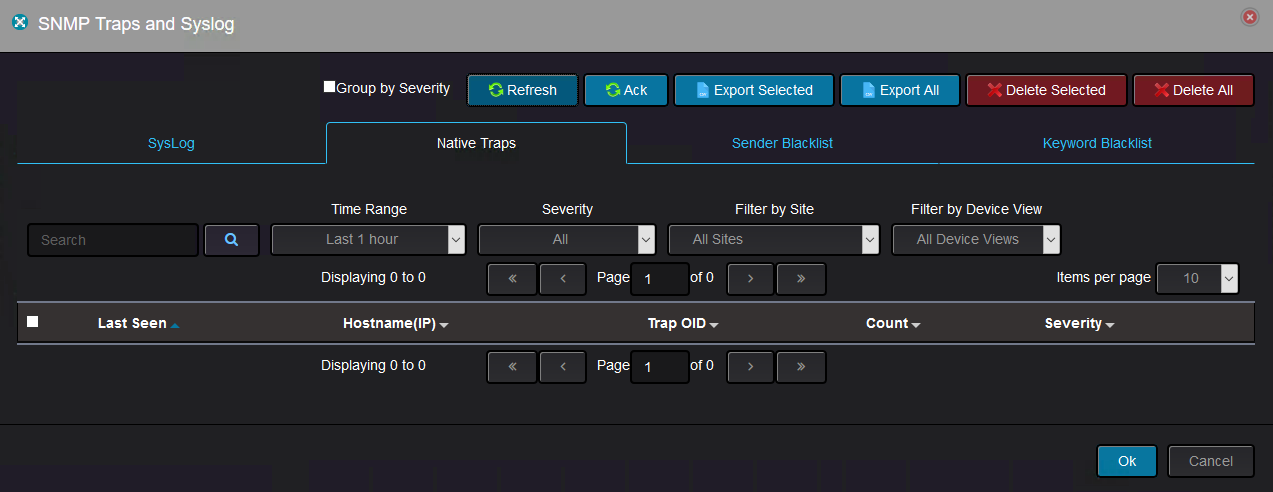
The SNMP traps are located in top menu “Logs” -> “SNMP traps and Syslog”.

More exactly here:

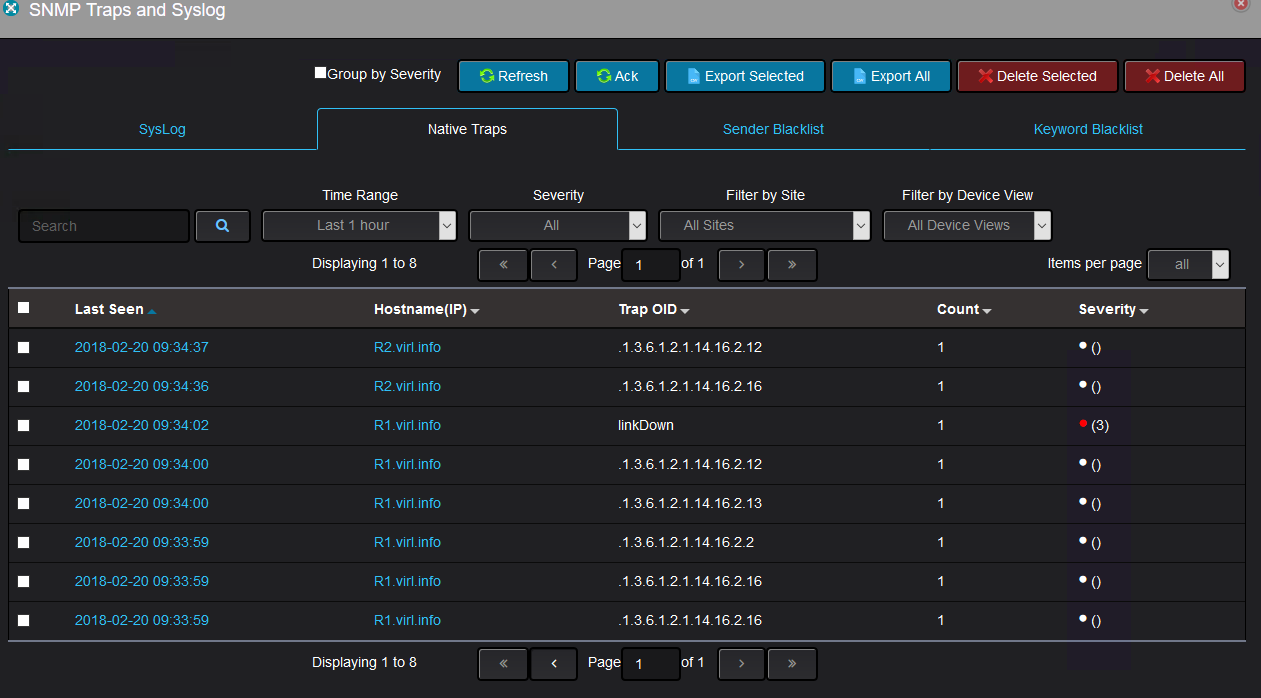
Once the devices starts sending SNMP traps, they appears withing 2-3 minutes in Nectus:

At the time of the writing, the new SNMP traps decoding is added manually by the Nectus support team, but in the future the operator will have the ability to add the traps decoding with no external assistance.
All these traps were sent by R1 and R2 when GigabitEthernet0/1 on R1 was shut down. Because OSPF was running between R1 and R2, disabling the interface lead to OSPF adjacency between the two routers to go down.
As you can see, some OIDs are represented their original format, whereas some OIDs are represented in a more human readable format.
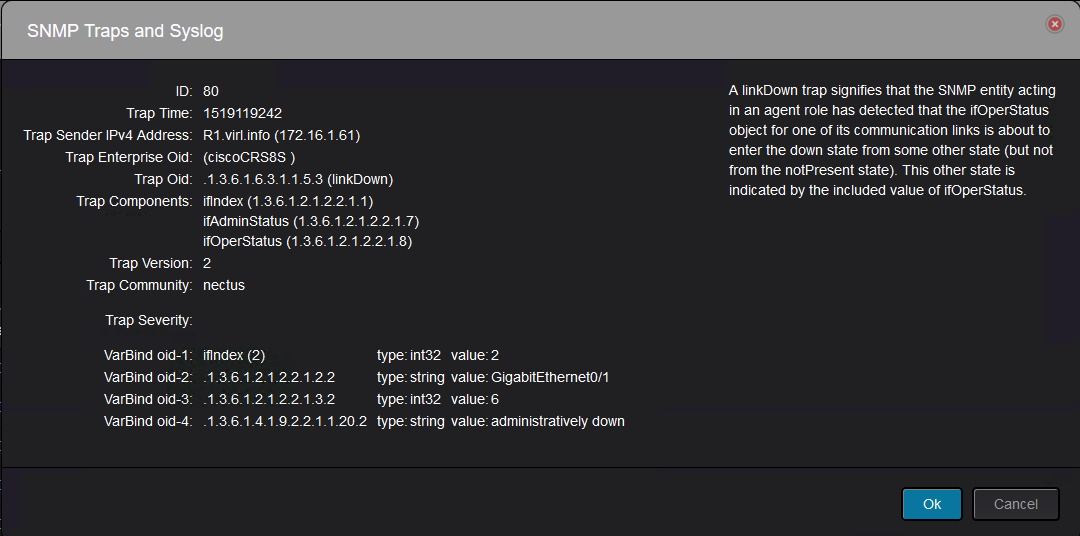
The details of a trap might look like this:

With the above trap details, you can tell that this is “link down” trap.
However, with other traps, you might need additional knowledge to figure what they represent.
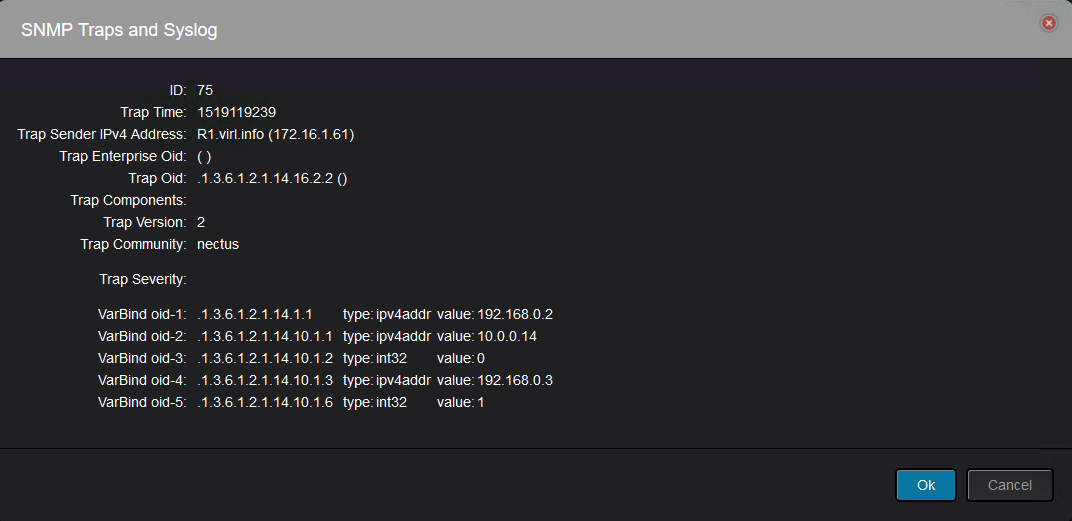
Let’s take another example of detailed trap:

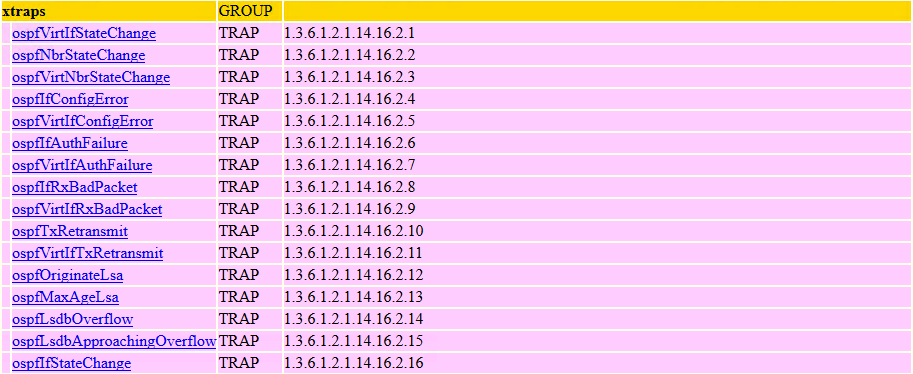
This trap was sent by R1 and it is a neighbor state change(.1.3.6.1.2.1.14.16.2.2):

And it can be read like this: Router-ID 192.168.0.2(.1.3.6.1.2.1.14.1.1) declared neighbor 192.168.0.3(.1.3.6.1.2.1.14.10.1.3) with IP address on the interface 10.0.0.14(.1.3.6.1.2.1.14.10.1.1) as Down(.1.3.6.1.2.1.14.10.1.6 with value of 1).
Obviously this is not very intuitive and Nectus should do all the the decoding so that the operator will not go through all the effort to find what each OID means.

In the future releases user will have an option  to add the decoding for new or unknown SNMP traps via GUI.


Nectus can monitor OpenFlow capable devices in the same way as the non-OpenFlow devices.
In this article we will show how Nectus can discover and monitor switches that are SDN OpenFlow ready.
We will use following sample topology  for demonstration with Floodlight OpenFlow controller and three OpenFlow switches: Read more

Under the Tools menu, there are quite a few tools that can help the operator to understand better the network, to perform troubleshooting and to gather information from devices.
These are the options: Read more

This post will cover the SysLog server functionality of  Nectus network monitoring software.
As with any modern network monitoring software Nectus has the ability to receive and store the syslog messages from routers, switches or servers.
Syslog messages can be accessed from Top menu “Logs”: Read more

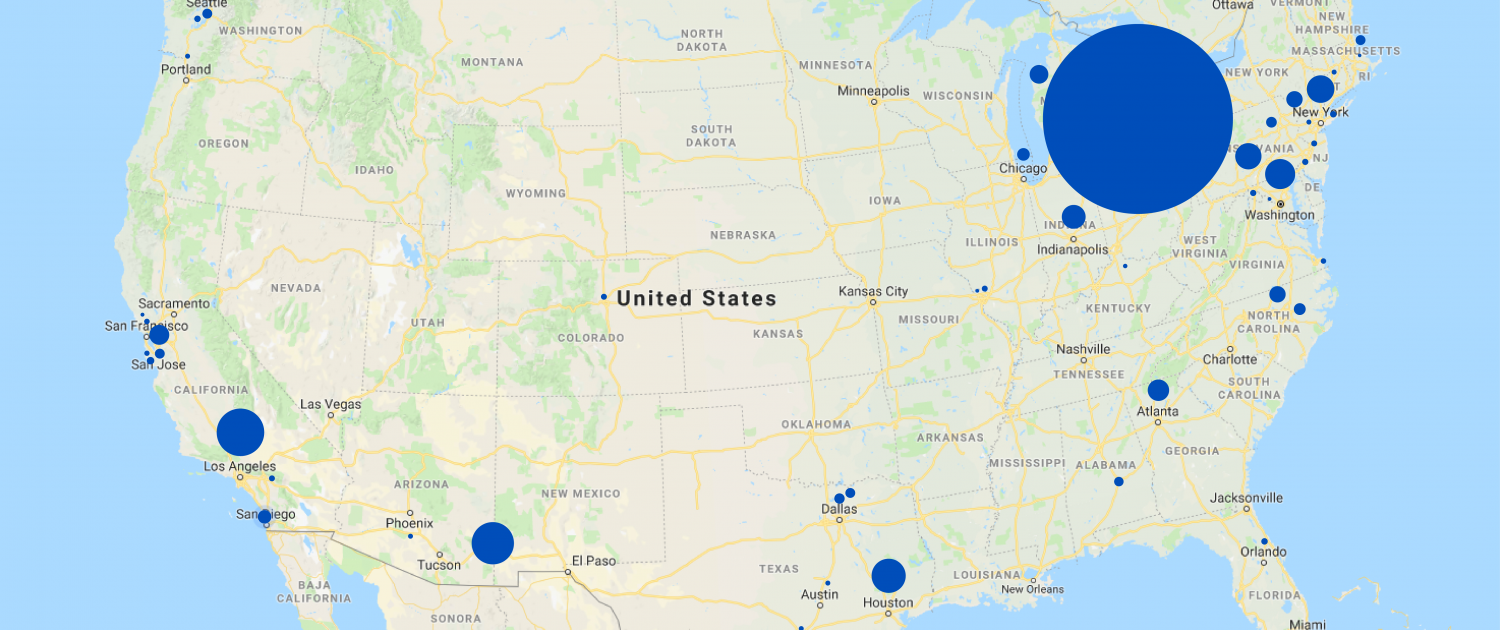
Note: Information is based on Nectus IP geo-location service

State City IPv4 Addresses
Ohio Columbus 225326103
California Los Angeles 54776440
Arizona Fort Huachuca 54644594
Texas Houston 42689210
District of Columbia Washington 32721834
New York New York City 31867103
Virginia Ashburn 31828300
Indiana Indianapolis 26421929
Georgia Atlanta 25527566
California Palo Alto 25105708
Washington Redmond 24885468
Michigan Dearborn 23705811
North Carolina Durham 21588969
New Jersey Newark 21491795
California San Diego 21485402
Illinois Chicago 20074587
North Carolina Raleigh 18955414
New Jersey Bedminster 17843408
Texas Richardson 17241943
Texas Dallas 16869204
Massachusetts Cambridge 15868348
California San Jose 15336783
Washington Seattle 15260827
Alabama Montgomery 14906638
California Cupertino 13954110
Washington Bellevue 13800919
Connecticut Fairfield 13507953
California San Francisco 12561267
Pennsylvania Philadelphia 12464449
Virginia Reston 11731922
Florida Lake Mary 10572081
New Jersey Mount Laurel 10087552
Colorado Denver 9869523
Missouri Saint Louis 9426794
California Norwalk 9273764
Virginia Virginia Beach 9107341
Michigan Ann Arbor 8772940
California Mountain View 8474238
Connecticut Middletown 8241397
Texas San Antonio 7877211
Texas Austin 7734993
Arizona Phoenix 7649529
Oregon Portland 7600141
New Jersey Rahway 7312241
Florida Miami 6713810
Ohio Cincinnati 6688810
California Concord 6607183
Virginia Dulles 6470388
Missouri Town and Country 5898488
Massachusetts Boston 5557232
Louisiana Monroe 5300043
Colorado Greenwood Village 5070591
Pennsylvania Pittsburgh 4780729
Missouri Kansas City 4578123
Virginia Herndon 4492530
Michigan Detroit 4336217
Pennsylvania Doylestown 4203957
North Carolina Charlotte 4085710
Tennessee Nashville 3916537
Georgia Duluth 3805720
Nevada Las Vegas 3792683
Illinois Naperville 3716723
Florida Orlando 3665033
California Sacramento 3601243
Utah Salt Lake City 3592200
Alabama Redstone Arsenal 3428226
Minnesota Minneapolis 3412363
Florida Tampa 3400441
New Jersey Morristown 3304100
California Santa Clara 3252933
New York Rochester 3189712
Maryland Baltimore 3079657
Minnesota Saint Paul 3019512
Arizona Kingman 2983075
Massachusetts Springfield 2927039
Wisconsin Milwaukee 2811053
Colorado Fort Collins 2752782
Wisconsin Madison 2732615
California Belmont 2725536
Texas Plano 2671935
Virginia Arlington 2668836
Connecticut Stamford 2609471
Ohio Cleveland 2600011
Kansas Overland Park 2528866
Texas Irving 2512563
Kentucky Richmond 2509411
Texas Fort Worth 2494944
Arkansas Little Rock 2446145
Florida Jacksonville 2423627
Missouri Columbia 2266295
Oregon Beaverton 2224613
New York Buffalo 2210272
California San Ramon 2131203
Ohio Akron 2098568
California Pleasanton 2097585
Maryland Rockville 2072266
California San Mateo 2044008
Nebraska Omaha 2020147
New York Albany 2018827

Meltdown and Spectre bugs in simple words.

All modern processors have very important feature called “Speculative Execution” where CPU tries to predict all possible operations that might be required to be executed next and actually executing those without knowing for sure which one will be the next.

Those guesses are called Speculative Branches. By the time when next operation is determined CPU already executed it as part of “Speculative Execution” but it also executed all other branches that no longer needed. Not only it executed unneeded operations it also kept the data for those branches. Data that was processed during unneeded Speculative Execution branches remains accessible for some time before it is completely discarded.

But data protection is only enforced for main execution branch, but not for Speculative Execution branches making it possible to access sensitive data that normally should not be accessible. Good intentions causes harm..

One of the latest features that was added this week is “Routing Table” view in device context menu. Read more

Trust me. CLI is not going anywhere. CLI is the only way to troubleshoot SDN.
There will be plenty of new CLI commands to “show” flow tables logic, operation
and debug communications between data plane and controller.

I would say importance of CLI is even greater in SDN as you now has
to observe operation between Control plane and Data plane which previously “just worked”.

CLI is here to stay, it just going to be used mostly for monitoring rather than configuration.


So.. you upgraded your network from legacy dedicated hardware to OpenFlow based SDN, laid off all of your network engineers who know CLI and ask yourself a question: How do I monitor my SDN now?

How do I pull a power supply status or CPU temperature? How to read TCAM utilization level? How to see an SFP status or number of CRC errors?

If we look into OpenFlow specifications, it defines communication protocol between OpenFlow controller (control plane) and OpenFlow switch (data plane) it goes into details of flow creation and management but there is nothing that tells how hardware monitoring has to be implemented on OpenFlow SDN switch.

Access to operational monitoring features that we love so much is not a part of OpenFlow specifications and will not be a part of SDN controller functionality. Old and proven SNMP-based monitoring is likely to continue to be a primary way to monitor your Data plane operation as it was with legacy dedicated hardware unless OpenFlow specs get expanded with new monitoring specifications.


Download the best SDN monitoring tool

This post will cover how Nectus can dynamically build topologies and how you can check various performance statistics.
Nectus gives the possibility to build automatically L2 and L3 topologies based on the discovered devices.
Additionally, it allows the administrator to create custom topologies by dragging on the map the devices that are required to be on the topology. Read more

This post will cover the configuration backup and change tracking features available in Nectus.
Nectus provides the ability to back up the configuration of the devices discovered, on a scheduled basis and manually.
Nectus comes with some default settings regarding the configuration backup and for others administrator input is required.
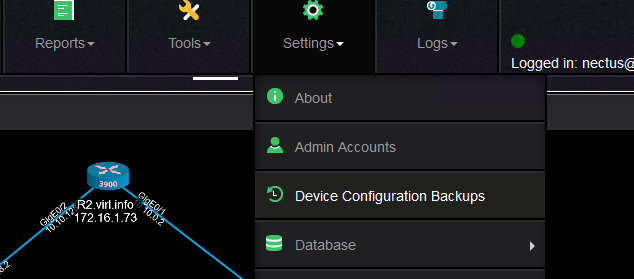
This is the configuration backup settings menu:
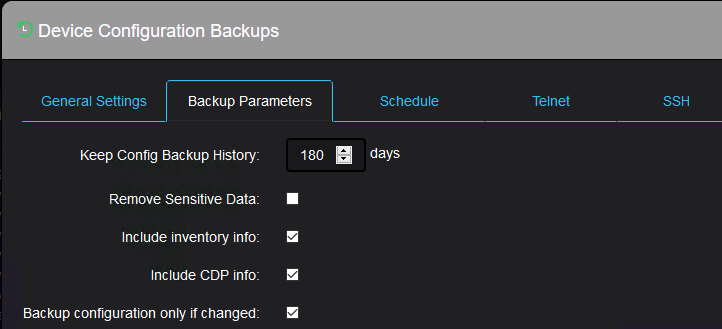
Multiple tabs on the menu allows you to specify some parameters like what to be backed up and for how long to keep a configuration backup:
Or how often and when the automatic backup should happen:
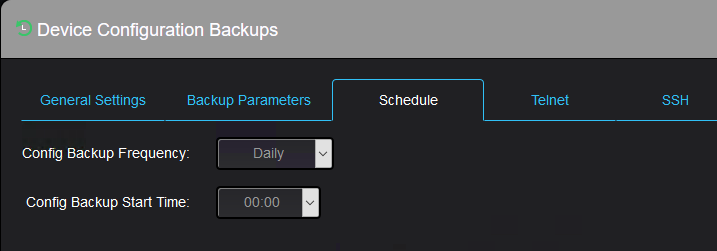
The next two tabs are for telnet protocol configuration:

And ssh protocol configuration:

The remaining two tabs allows the administrator to use custom specific scripts for backup (in case you would like to perform partial backup for instance).
Nectus must connect to the device using a valid username/password combination on that device.
If the username/password exist on the device, then it must be fed to Nectus.
This is where you set this up:
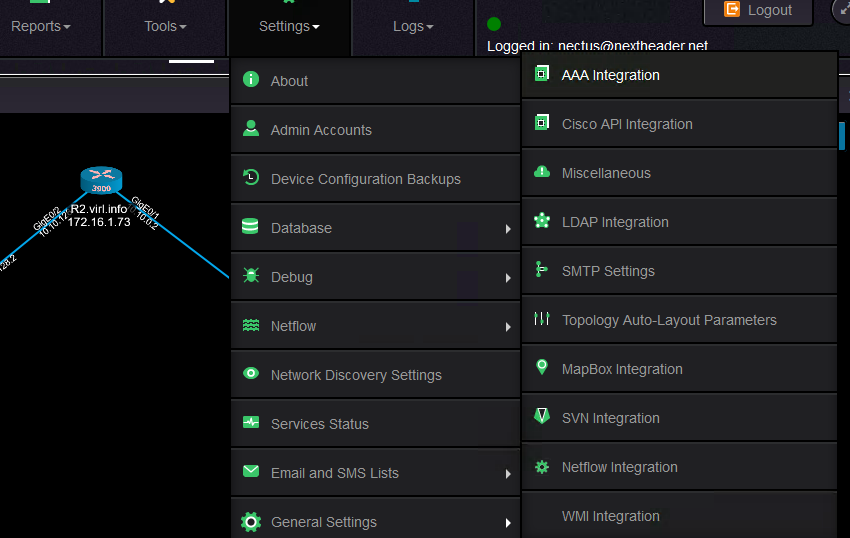
And these are the input values required
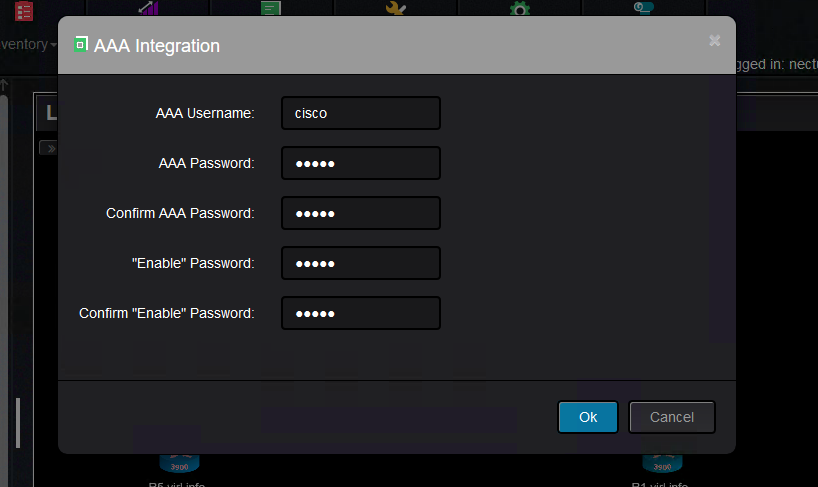
Once this is done, you can backup configuration per device, per group of devices (vendor, platform, model) or for all devices.
This is how you can backup a group of devices, which in this case is the same as all the devices are backed up (this is because there are only Cisco devices in the topology):

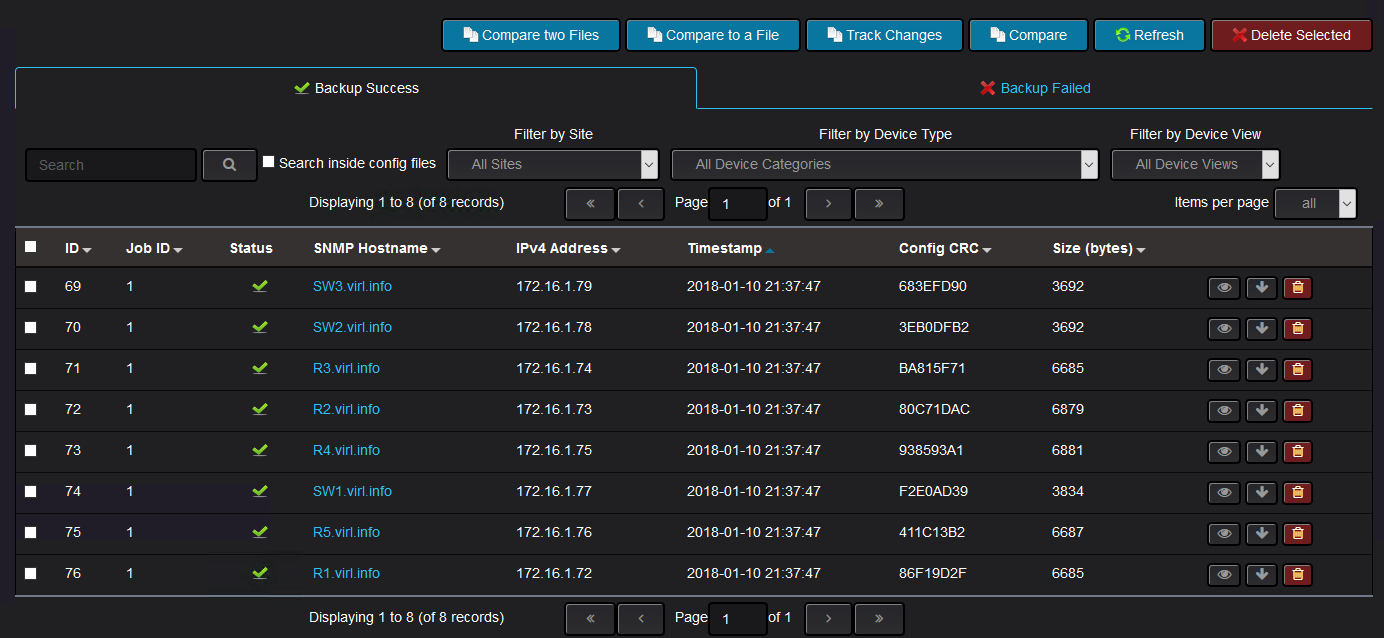
From the inventory menu, you can see the successful backups and the failed backups.
If the backup failed, then you would see like this:
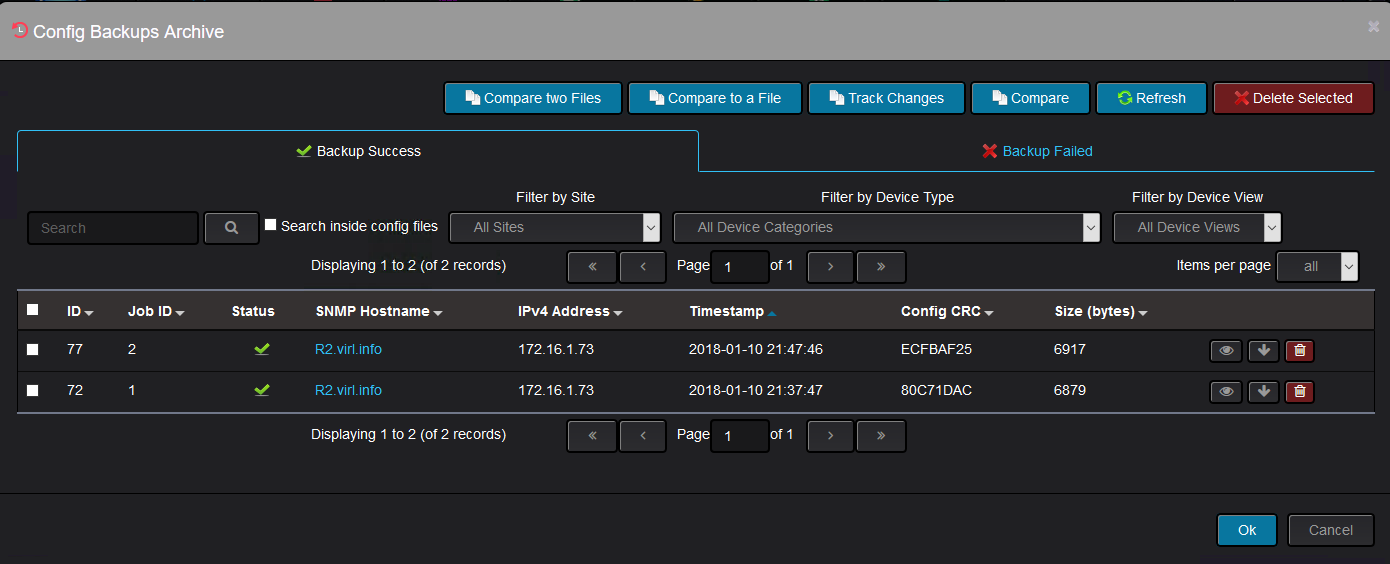
You can see the reason it failed, which in this is because Nectus could not establish a telnet or SSH connection to the device:

If the backup is successful, the device configuration should show up:
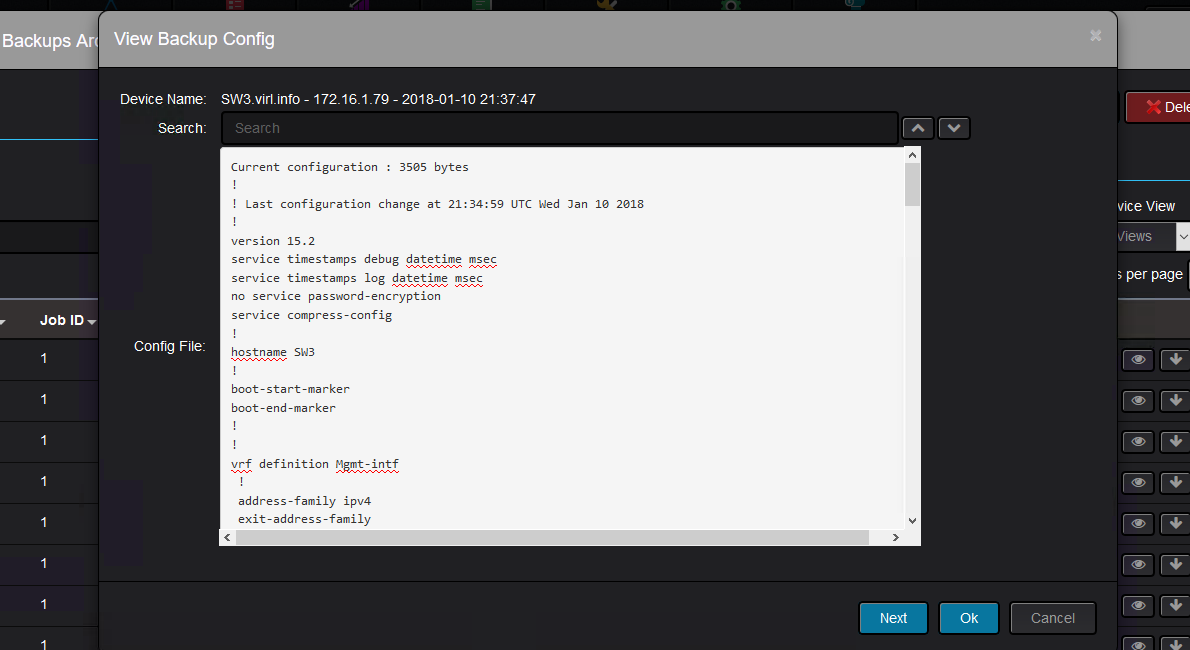
Clicking on any of the files, you will see the configuration of the device at the time configuration backup was triggered:
Each device context menu has a configuration backup section where you can perform various actions:

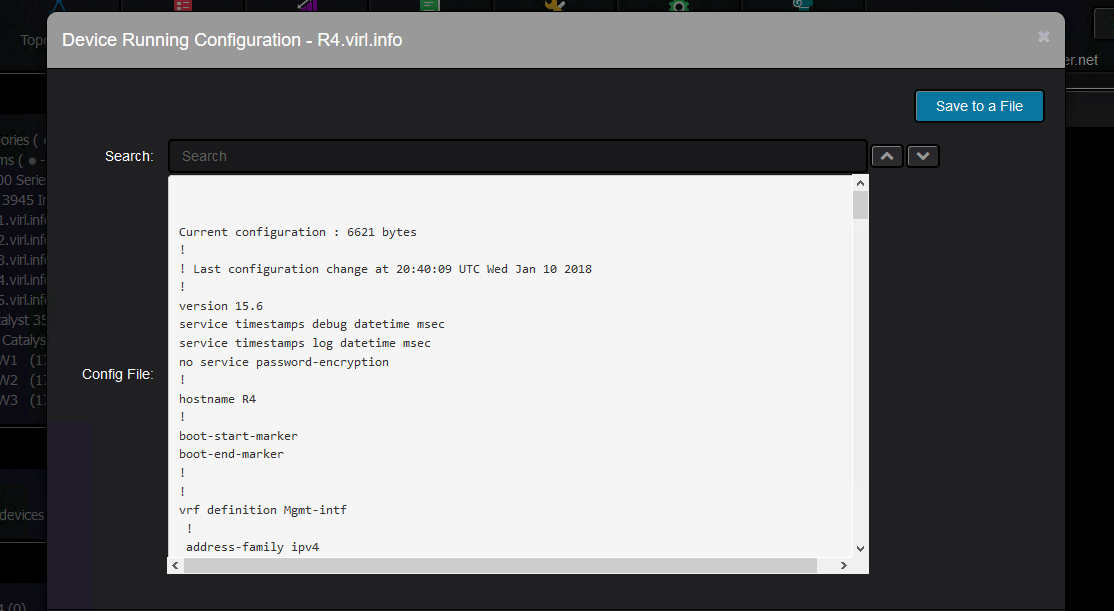
You can backup the configuration, view the running configuration:
Or you can view the archive of all the device backups:

Further on, you can compare two backup files to see what has changed.
They do not need to be consecutive backups. Here, “auto-cost reference-bandwidth” was configured on the device:

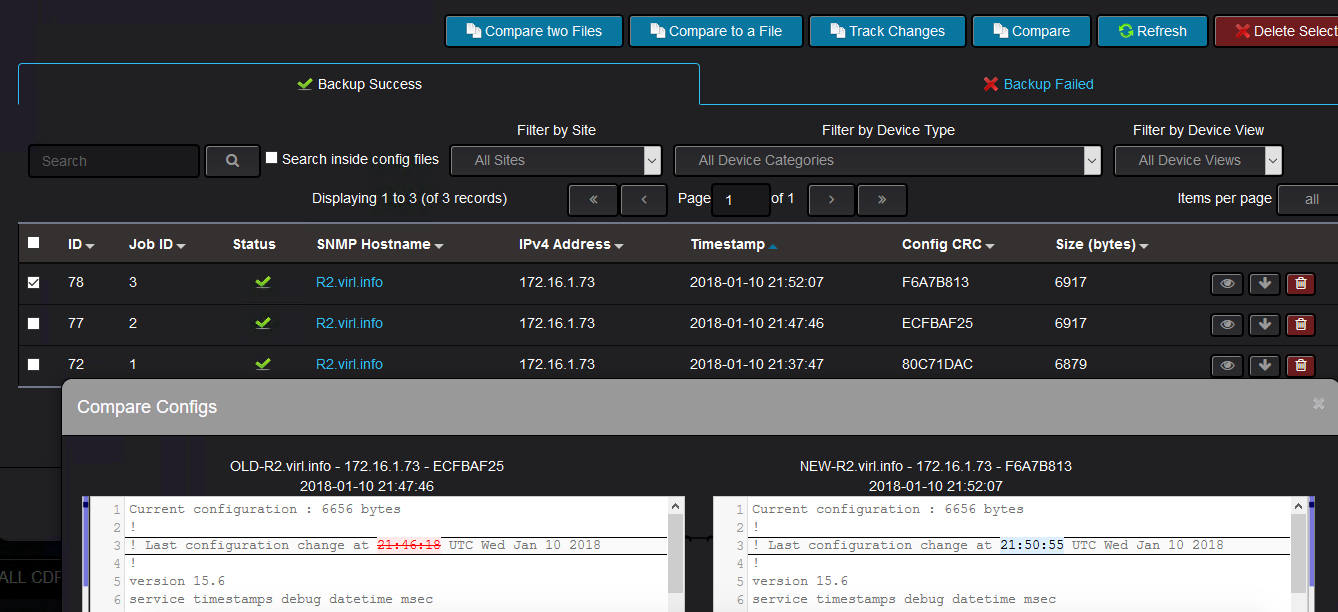
Another useful feature is the tracking change feature which shows the changes between two consecutive backups.
You select the newer backup and Nectus will show what has changed since the previous backup was taken:
In case there are backups that were taken before Nectus was deployed and you would like to see what are the changes between those configurations and the ones taken by Nectus,
you have the possibility to compare the Nectus backups with the external files. You can even compare two external configuration backups with the help of Nectus.
Another useful feature that is related to configuration backup, is the report that tracks the devices whose configuration was not saved after the last change.

You can trigger this report like this:
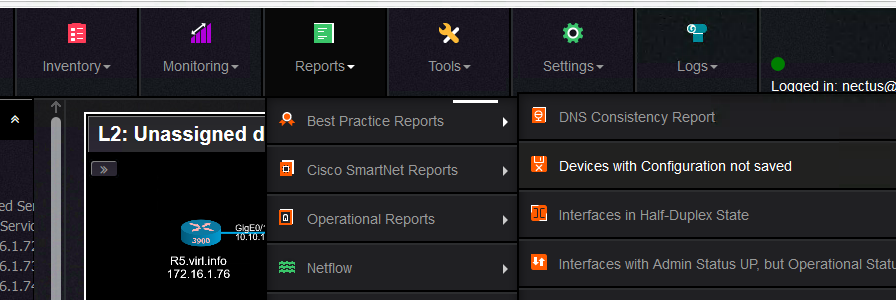
You can specify if you want to send the report to an email address and if you also want to keep this report for auditing purposes:
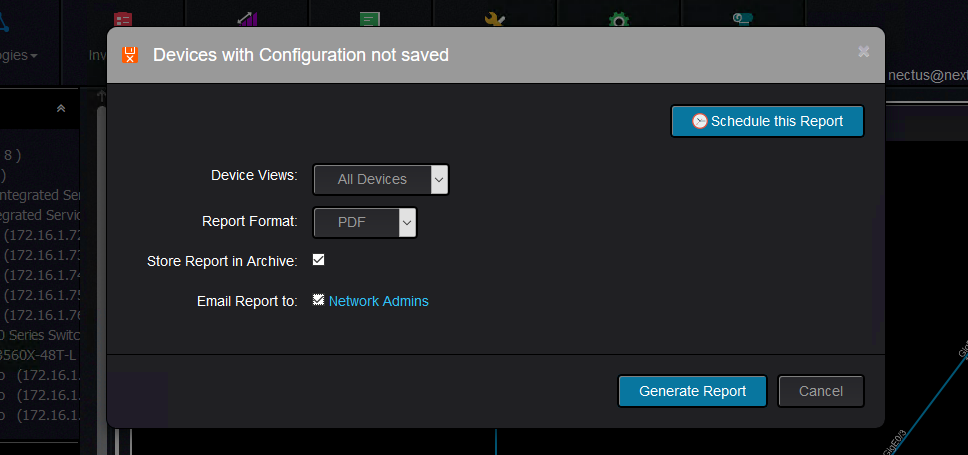
And the report looks like this:

Keep in mind that the time you see in the report is the uptime of the router. For instance, in the above example,
the device configuration was saved last time when the router had an uptime of 1h47m
and the last configuration change was done when the router had an uptime of 1h50m.
And this would pretty much all about configuration backup and change tracking in Nectus and how it can help you to save your configurations and see
what has changes from one backup to the next one or any other backup.

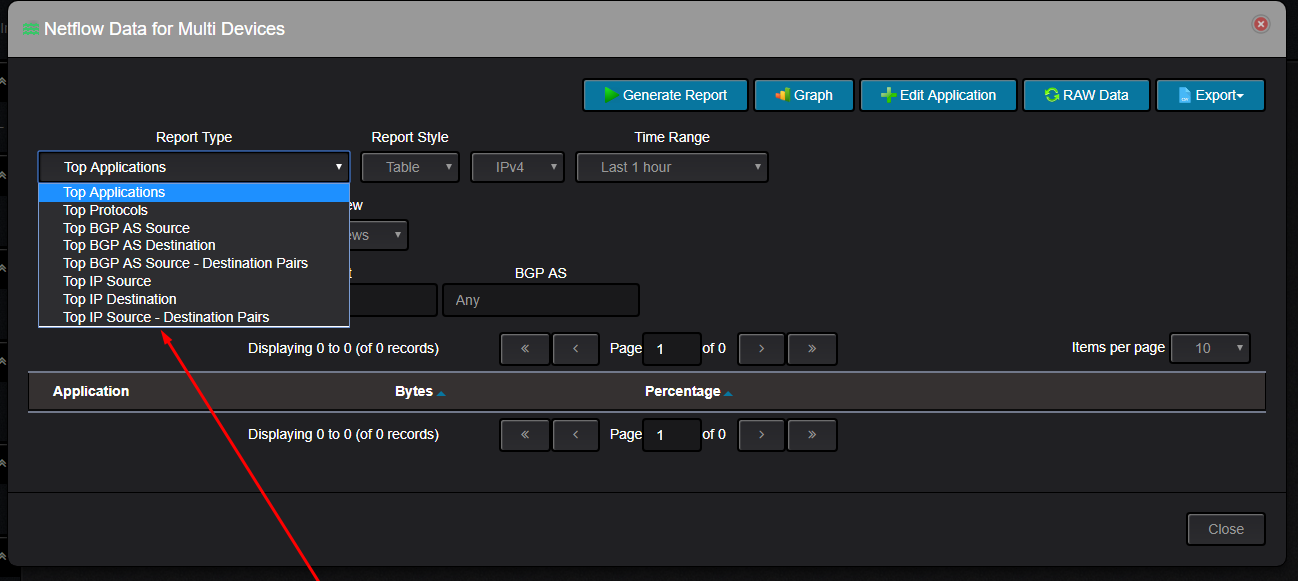
Here is the list of NetFlow reports currently supported by Nectus

Top Applications
Top Protocols
Top Source IP
Top Destination IP
Top Source + Destination IP pairs
Top Source BGP AS
Top Destination BGP AS
Top Source + Destination BGP Pairs


Nectus beats Solarwinds in pretty much any aspect: Speed, Usability, Size, Installation Time, Support.
We optimize every little function or procedure to perfection and re-write it with Assembler language if it is not good enough.

We develop custom stress-testing tools  (such as Netflow Generator ) so we can push the Nectus KPI limits higher.

Our product is designed by CCIEs for CCIEs and every single UI page is designed by active network engineer that knows exactly how information should be presented because they use Nectus themselves every day.

We also have a three-click rule: Any information that user wants must be available in no more than 3 clicks.
Also Nectus doesn’t have a User Manual. Because it does not need any.

Download your 60-day trial