Nectus offer new way to see your network in real time
To keep a good track of your network it is necessary to have a network diagram of your topology so you can know for sure where each device is located, where it is connected and in case there is a failure in your network it is easier to find the devices affected.
You can create your own topology and add each device manually even though that may take a lot of time depending on the size of your network and every time a new device is added to the network, you must add it to your topology manually. Sounds like a lot of work.
Luckily with Nectus this process can be avoided! Nectus can generate Layer 2 and Layer 3 topologies in just one click and if a new device is added to your network, it is added automatically to your topology.
This is how your topology would look like:
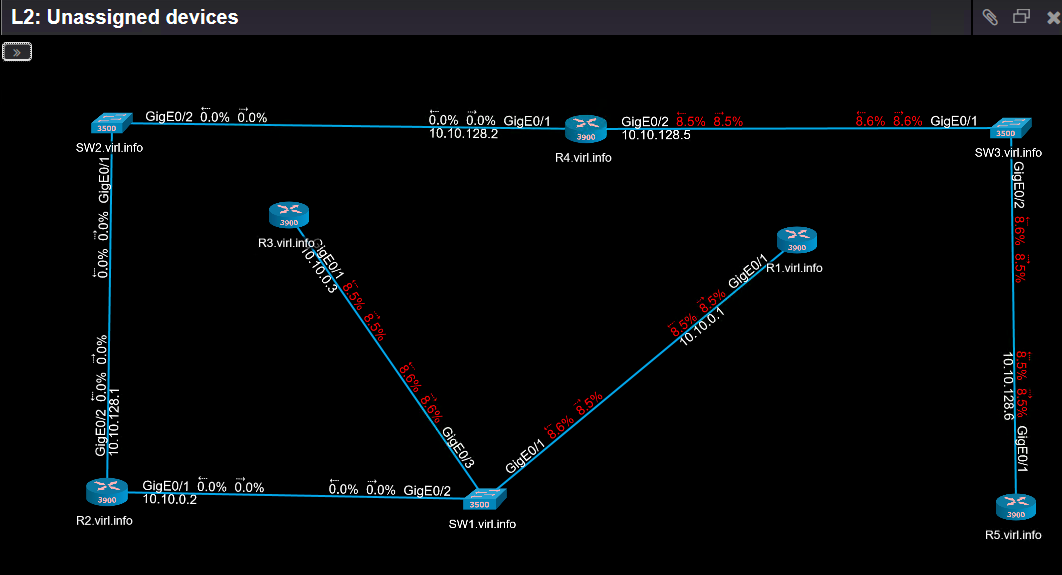
And once your topology is ready you can perform various actions to get live stats of your network’s performance and usage such as:
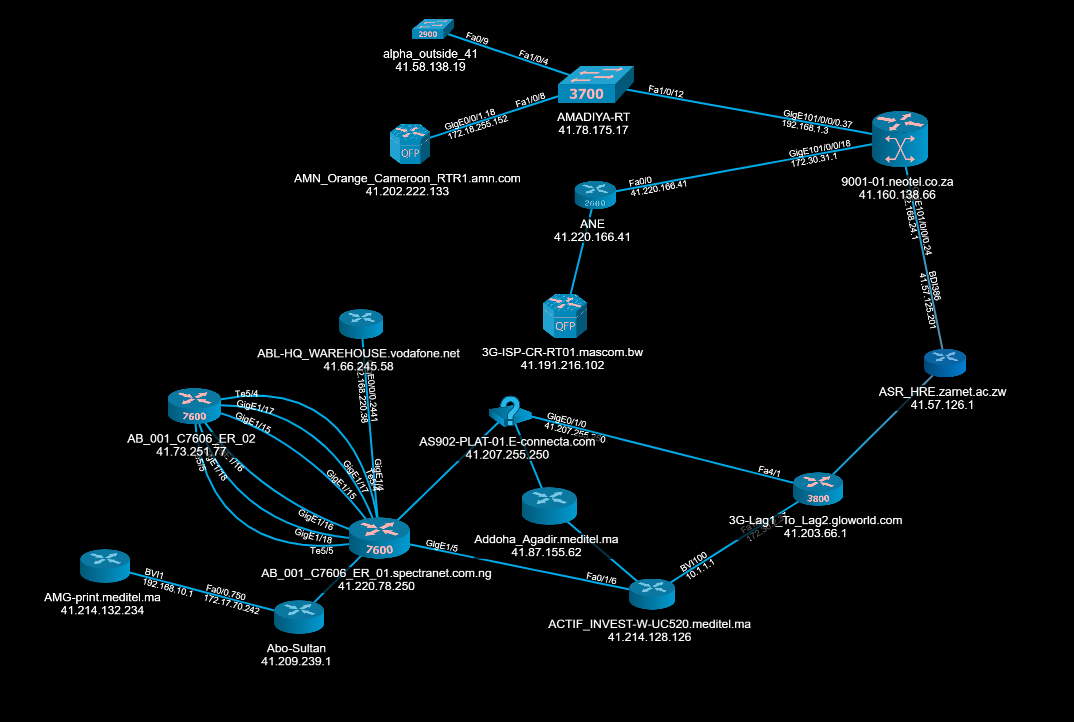
- Show graphs of all basic metrics for each interface: utilization, errors, dropped packets, availably and traffic volume.
Here is an example of an Interface Utilization Graph:
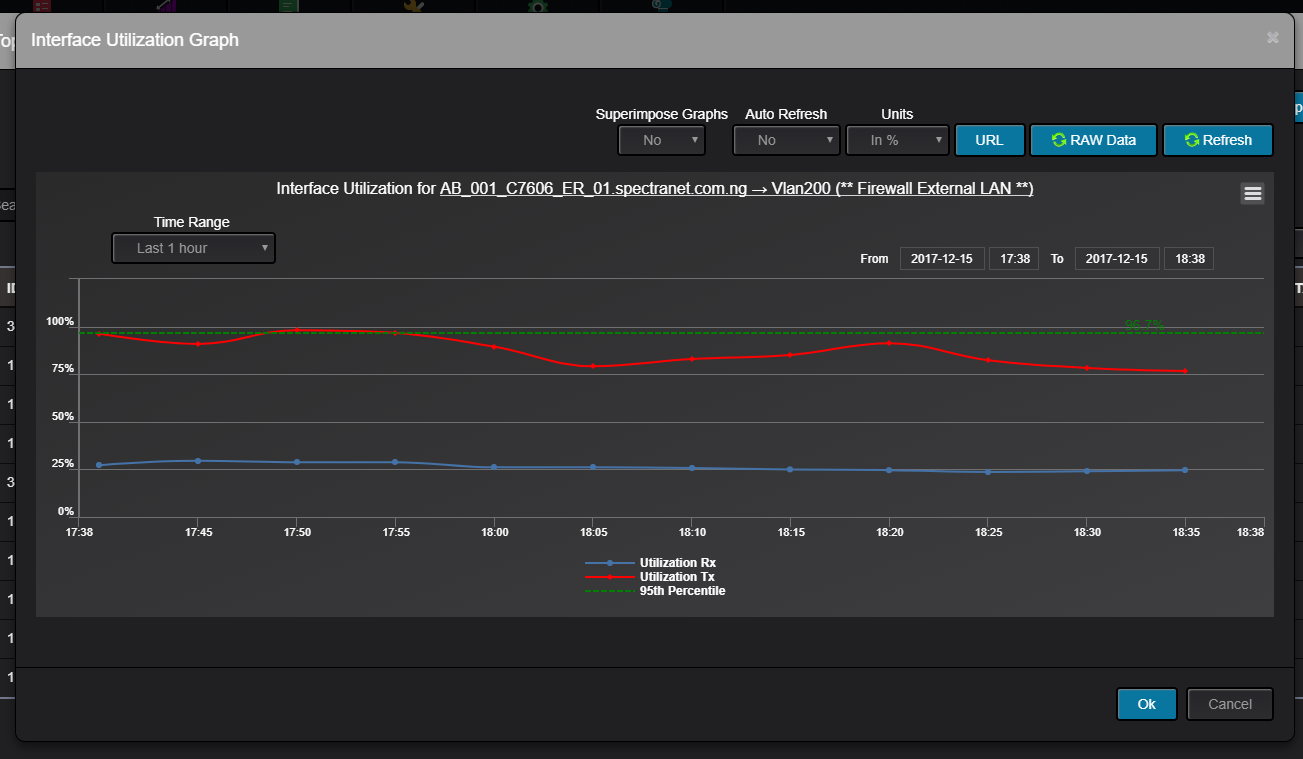
- Show interface and device availability status. If an interface or device goes down, it will generate and alarm sound and show red blinking color directly on Topology screen.
Here is how it would look like if a device went down:
- User can interact with topology via device and links context menus and generate reports directly from Topology GUI.
With just one click users can generate graphs to monitor a link’s performance and show link info as pictured below:
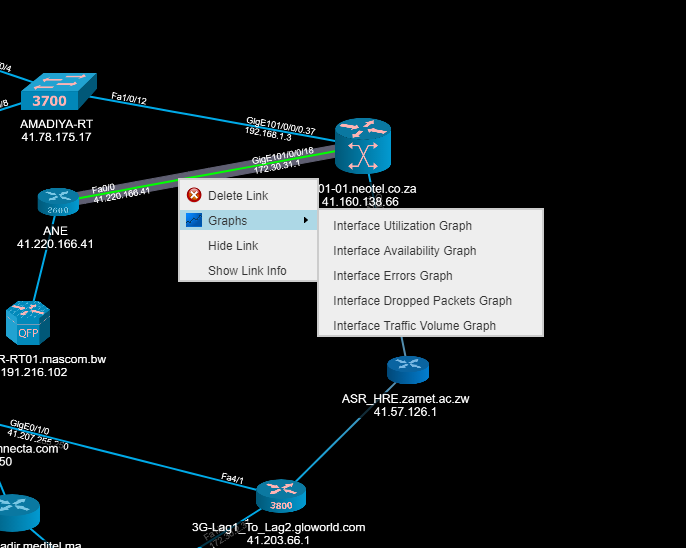
Users can see real-time performance graphs from each device on the network, show device basic info, ping device from browser, start an SSH session and generate Cisco SmartNet reports directly from the topology by just right clicking on any device.
This is an example of latency graph for single device:
Nectus offers new way to create and keep up to date your network topology, making your network topology live and interactive.
It keeps track of all performance metric and displays is directly on topology with all its real-time stats, making it easier and faster to detect a failure and correct it.
Leave a Reply
Want to join the discussion?Feel free to contribute!